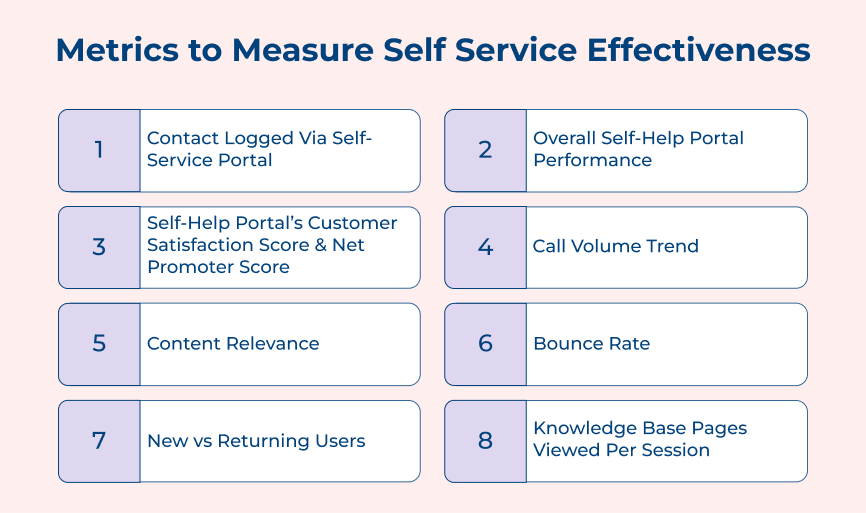
1. Contact logged via Self-Service Portal
When it comes to measuring and improving self service performance, one key metric to consider is the number of contacts logged via the self-service portal. The metric indicates how often customers use the self-service option to find answers to their questions or resolve issues independently.
The target of this metric is to increase the percentage of customer inquiries that are resolved through self-service. It improves customer satisfaction and success rates. The formula for this metric is:
The number of contacts logged via self-service portal / Total number of customer contacts x 100.
Best practice:
- Ensure that the self-service portal is easily accessible and prominently featured on the company website.
- Provide clear and comprehensive information on the portal to address common customer issues.
- Encourage customers to use the self-service portal through targeted promotions, incentives or proactive communication about its benefits.
2. Overall Self-Help Portal Performance
One important metric to measure the effectiveness of a self-help portal is overall self-help portal performance. It focuses on the overall performance of the portal in terms of user satisfaction, resolution rates and efficiency. The business value of the metric lies in its ability to assess how well the self-help portal is meeting the needs of users and helping them find solutions to their problems.
A high-performance score indicates that the portal effectively provides valuable support to customers, leading to increased customer satisfaction and loyalty. The target of the self service metric is to achieve a high-performance score, indicating that the portal is user-friendly, easy to navigate and provides relevant information to users.
The formula for calculating overall self-help portal performance can be: Performance Score = (Number of resolved issues / Total number of issues reported) x 100
Best practices:
- Continuously update and optimize the content on the self-help portal to ensure it is up-to-date.
- Implement user-friendly search functionality and navigation to make it easy for users to find the information they need.
- Collect feedback from users regularly to identify areas for improvement and make necessary adjustments to enhance the portal’s performance.
3. Self-Help Portal’s Customer Satisfaction Score & Net Promoter Score
Measuring customer satisfaction and loyalty is crucial in determining the effectiveness of self-help resources. Two key self service KPIs for evaluating this are the Customer Satisfaction Score (CSAT) and the Net Promoter Score (NPS). The CSAT measures how satisfied customers are with the self-help portal’s services, often through a survey or rating system.
The NPS measures customer loyalty by asking how likely customers are to recommend the portal to others. The business value of these metrics lies in the ability to identify areas for improvement in the self-help portal, leading to better customer retention and satisfaction. The target of these metrics is to continuously enhance the portal’s usability and effectiveness in meeting customers’ needs.
The formula for calculating CSAT is (Number of satisfied customers / Number of survey responses) x 100. The NPS is calculated by subtracting the percentage of detractors from the percentage of promoters.
Best practices:
- Regularly collecting feedback from users to identify pain points
- Providing personalized self-help resources based on user preferences
- Promoting a culture of continuous improvement within the team managing the self-service portal.
4. Call Volume Trend
The Call Volume Trend metric is a key indicator of how many customer inquiries are being directed toward the virtual agents. Monitoring the self service KPIs allows businesses to understand the volume of calls, identify trends over time and make strategic decisions to improve self-service options. Its business value lies in the ability to highlight areas where self-service options may be lacking or ineffective.
Businesses can lower their customer service costs and improve overall customer satisfaction by reducing the number of calls coming in. Its target is to reduce call volume by providing customers with easy-to-use self-service options such as FAQs, chatbots or online knowledge bases.
The formula for this metric:
(Total number of calls received / Total number of calls answered) x 100
Best practices:
- Invest in developing user-friendly self-service options to provide customers with quick and efficient solutions to their problems.
- Use call analytics to identify common reasons for customer calls and address these issues proactively through self-service channels.
- Train the customer service team to educate customers on self-service options and encourage them to utilize the resources before calling for assistance.
5. Content Relevance
Content relevance is a crucial aspect to measure and improve self service rate. It analyzes how well the content provided to users aligns with their needs and expectations. The business value of content relevance lies in ensuring that the information presented to users is timely, accurate and easy to understand. Businesses can optimize their self-service platforms to provide relevant content that enhances the overall customer experience by measuring the self-service performance.
The target of content relevance is to increase customer satisfaction and reduce the need for additional support by delivering content that directly addresses user queries or issues. The formula for calculating Content Relevance is the number of relevant interactions divided by the total number of interactions, multiplied by 100 to get a percentage.
Best practices:
- Conduct regular content audits to ensure that all information provided is up-to-date and aligned with user needs.
- Utilize customer data analytics to refine and customize content for different user segments.
- Implement AI and machine learning technologies to automatically personalize content based on user preferences.
6. Bounce Rate
Bounce rate is a key metric to measure and improve self-service effectiveness on the website. It represents the percentage of visitors who navigate away from the site after viewing only one page. A high bounce rate can indicate that visitors are not finding what they are looking for or that the website is not engaging enough. If you run a self-service portal, it can fall between 10 to 30%.
The target of the bounce rate is to keep it as low as possible, ideally below 50%. It can be achieved by providing clear navigation, relevant content and a user-friendly layout on the website. The formula for bounce rate is Bounce Rate = a total number of bounces / Total number of website visits.
Best practices:
- Increase page load speed to keep visitors engaged and prevent them from clicking away.
- Ensure the website is mobile responsive to provide a seamless user experience across all devices.
- Use engaging visuals and calls to action to encourage visitors to explore more pages on the website.
7. New vs Returning Users
New vs returning users is a crucial metric to measure self service effectiveness. It helps businesses understand the breakdown of their website or app visitors into two key categories: new users who visit for the first time and returning users who have visited before. The business value of this metric lies in its ability to provide insights into user behavior and engagement levels.
Businesses can tailor their marketing strategies and content to better meet the needs of both types of users by understanding the ratio of new vs returning users. The target of the self service KPI is to achieve a balance between attracting new users and retaining existing users. A healthy ratio of new vs returning users indicates that a business is successfully acquiring new customers while also keeping them engaged over time.
The formula for calculating this metric is:
(New users / Total users) x 100 = New user percentage
(Returning users / Total users) x 100 = Returning user percentage
Best practices:
- Personalize user experiences for both new and returning users to encourage engagement.
- Utilize targeted marketing campaigns to attract new users while also offering incentives for returning users to continue using your services.
- Analyze user behaviors to identify areas for improvement and make adjustments to enhance the overall user experience.
8. Knowledge base Pages viewed Per Session
Knowledge base pages viewed per session is one of the crucial self service KPIs used to measure and improve self-service effectiveness. It calculates the average number of knowledge base pages a user views during a single session on a website or platform. The business value of the metric lies in its ability to gauge the level of engagement and satisfaction users have with the self-service knowledge base.
A high number of pages viewed per session indicates that users are actively seeking information and finding value in the content provided. The target of such self-service KPIs is to increase the average number of pages viewed per session, leading to higher levels of customer self-service success and reduced support costs.
The formula for calculating this metric is – Knowledge base pages viewed per session = Total knowledge base pages viewed / Total number of sessions.
Best practices:
- Optimize navigation and search functionality within the knowledge base to make it easier for users to find relevant information.
- Regularly add new content to the knowledge base to keep users engaged and coming back for more.
- Analyze user behavior to identify areas for improvement and make necessary adjustments to enhance the user experience.
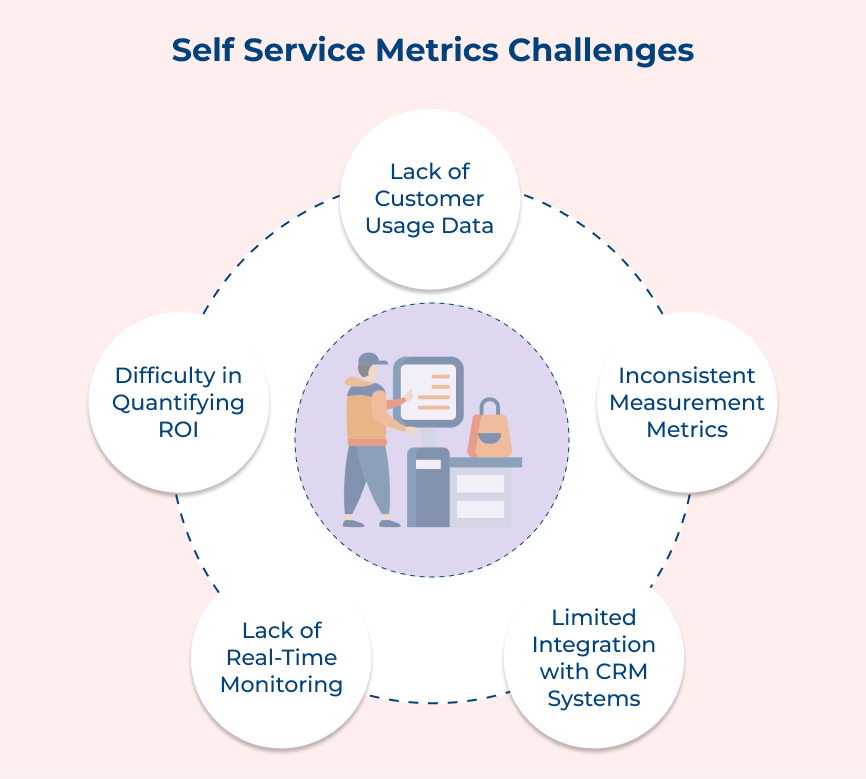
Challenges in Self Service Metrics
Check out the most common challenges businesses face with self-service metrics along with insights on how you can effectively overcome them.


