15 Top Help Desk KPIs & Metrics to Measure IT Support Performance
Navigate the world of top-notch service with help desk KPIs—the tools that will keep your team on track for quick solutions and happy customers.

Navigate the world of top-notch service with help desk KPIs—the tools that will keep your team on track for quick solutions and happy customers.

A robust help desk serves as the focal point of any successful business. It’s not just a platform to resolve issues; it’s the frontline of the brand’s reputation, where every interaction is an opportunity to create a positive customer experience.
Great customer experience can hit a business’s bottom line. More than 60% of consumers will pay at least 5% more if they know they’ll get a good customer experience. It is where the help desk metrics and KPIs help you measure your customer service support efforts quantitatively.
Measuring the metrics helps businesses success and pitfalls of customer service operations. Brands are enabled to make decisions based on tangible data rather than relying on guesswork. Before we dive into the metrics, it’s important to understand the basics and benefits of measuring such metrics!
Help desk key performance indicators (KPIs) refer to the quantifiable measurements used to evaluate the efficiency, effectiveness and overall performance of an IT support team. These indicators provide valuable insights into various aspects of help desk operations, enabling managers to make data-driven decisions and improve service quality.
The service desk metrics work by analyzing data from various sources, such as ticketing systems, customer surveys, and call logs. The information is then processed and presented in a meaningful format, often through dashboards or reports.
Key principles:
Explore the essential benefits of help desk KPIs and metrics to understand how they can transform your customer service experience.
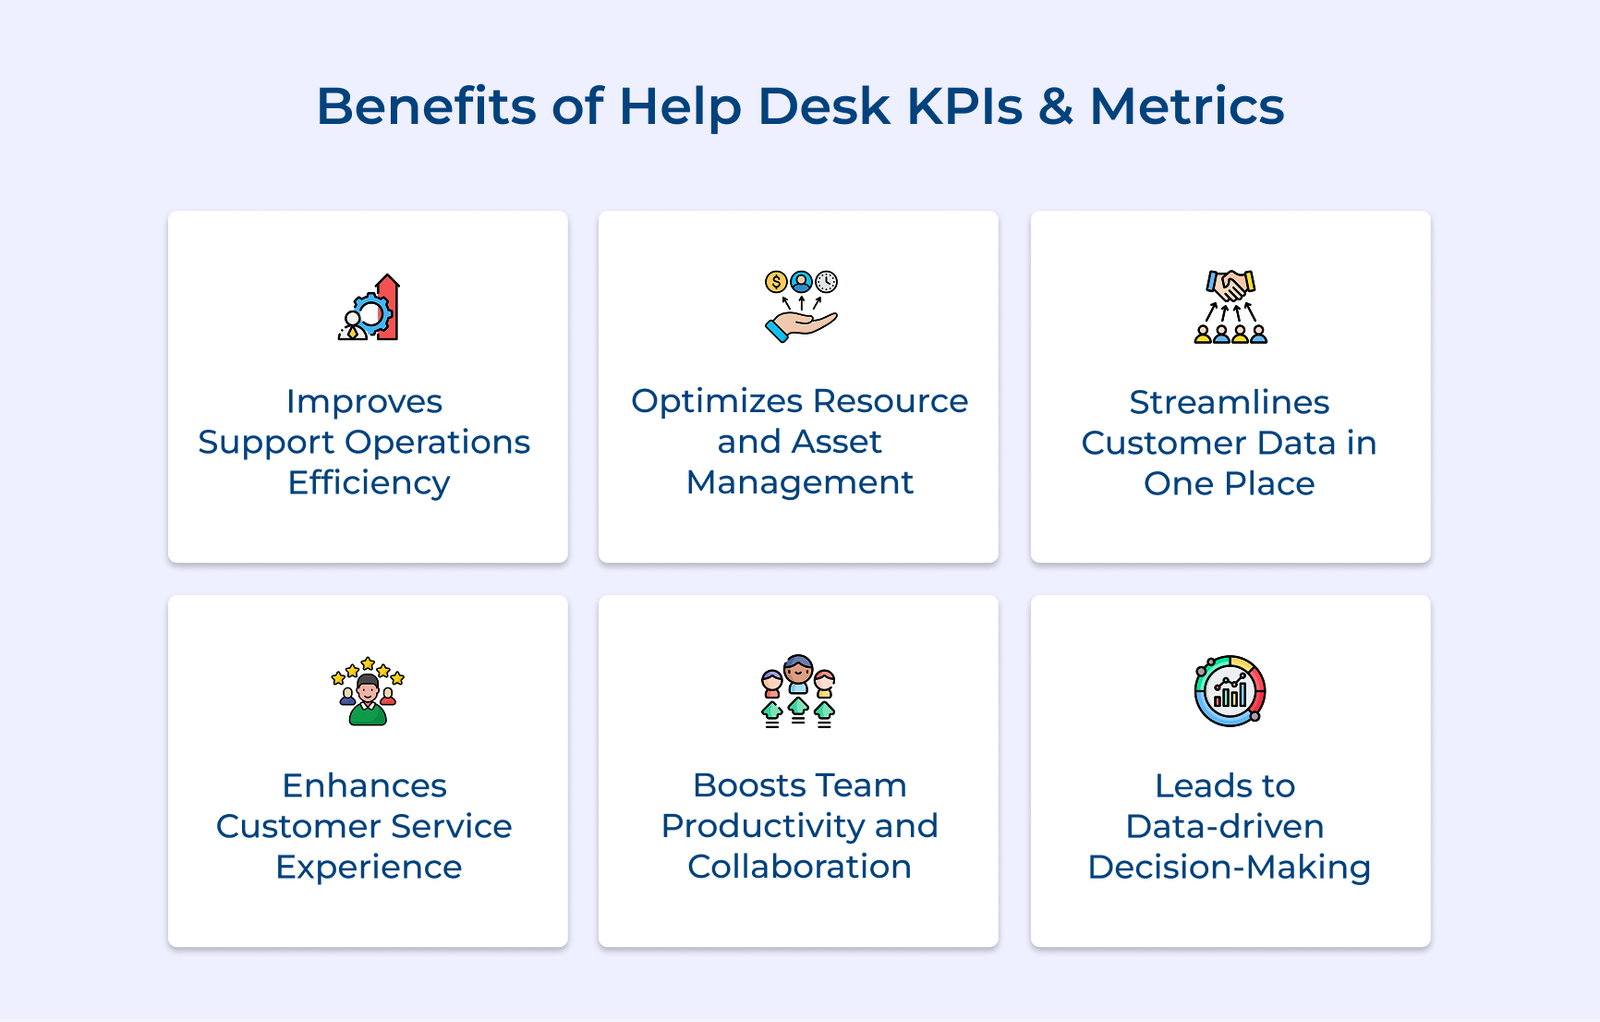
1. Improves Support Operations Efficiency
When a company gauges first response time and ticket resolution time, they get a more comprehensive picture of the areas that need improvement in the support operations. They can easily optimize processes, reduce response times and increase customer satisfaction.
2. Optimizes Resource and Asset Management
Tracking metrics such as ticket volume and agent workload allows the company to allocate resources more effectively. They can identify areas where additional resources might be needed or where processes can be streamlined, leading to cost savings and improved productivity.
3. Streamlines Customer Data in One Place
Service desk KPIs enable businesses to collect and store customer data in one centralized location. It makes it easier to track customer history, preferences and issues. The insights can be effectively leveraged to provide quicker and more personalized support.
4. Enhances Customer Service Experience
Businesses become more efficient at identifying areas for improvement and addressing any recurring issues. It leads to a better customer experience, increased loyalty and positive word-of-mouth referrals.
5. Boosts Team Productivity and Collaboration
Managers can identify their top-performing agents and areas where additional training or support may be needed. It also promotes collaboration among team members, as they get a chance to learn from each other’s successes and challenges.
6. Leads to Data-driven Decision-Making
The analysis gives businesses highly valuable data that helps drive strategic decision-making. It allows them to uncover trends, predict customer needs and implement proactive measures to prevent potential issues.
Let us go through the essential service desk metrics and KPIs that empower your support team to consistently deliver exceptional service.
1. Productivity metrics: They measure the efficiency of IT support teams, such as customer retention rate, open tickets and channel-wise performance
2. Performance metrics: Performance metrics evaluate the overall effectiveness of the help desk to resolve incidents or problems and adherence to service level agreements.
3. Quality metrics: Quality metrics assess the effectiveness and accuracy of IT support. It includes customer satisfaction ratings, customer feedback and the percentage of escalated tickets.
4. Financial metrics: Financial metrics measure the cost-effectiveness of IT support operations, including the total cost per ticket, cost per user, and return on investment for IT support tools.
Productivity Metrics
Productivity metrics help see how well things are running—whether projects are on time, if resources are used wisely, and how efficiently everyone is working.
The number of tickets or service requests is one of the vital service desk metrics because it provides valuable insights into the workload and efficiency of the help desk team. Companies can assess the level of support needed, identify patterns or trends and make data-driven decisions to boost customer satisfaction.

Calculating the number of tickets requests involves counting the total number of tickets or requests received within a specific time period. It could be daily, weekly, monthly or any other timeframe relevant to the brand’s operations. The average business has more than 500 tickets each day.
Best practices:
Ticket volume by channel is an important help desk metric because it provides valuable insights into the efficiency and effectiveness of different support channels. Businesses can identify trends, allocate resources accordingly and optimize their support processes for better customer satisfaction by tracking the volume of tickets received through different channels.
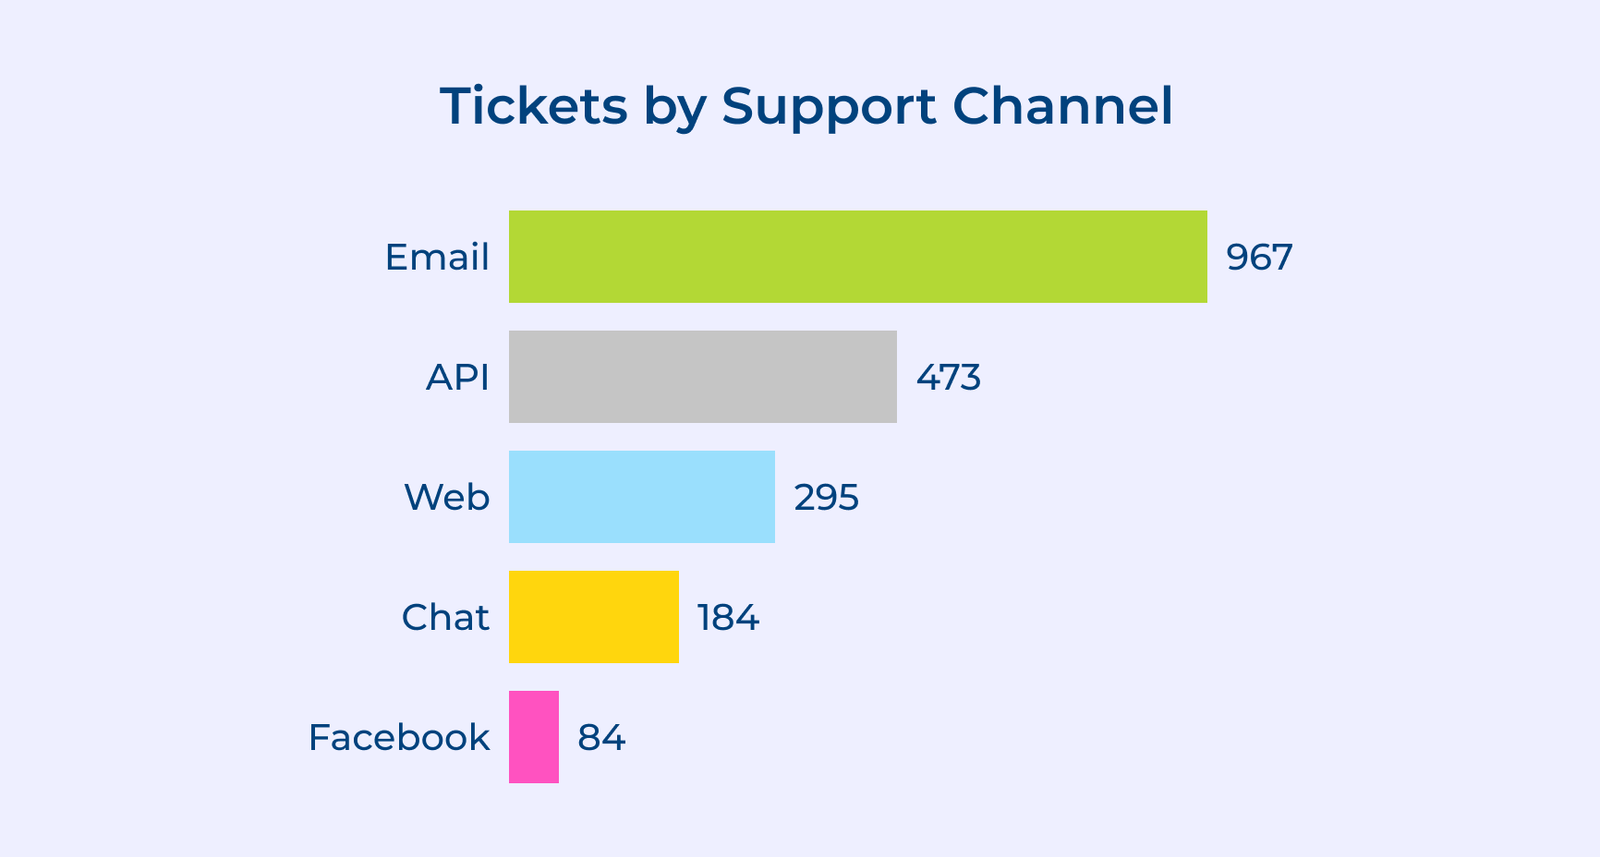
The formula to calculate ticket volume by support channel is to count the number of tickets received through each support channel (phone, mail, social media, etc) within a specific time frame (a day, a week, or a month).
Best practices:
On average a business loses 10 to 25% of its customers each year. Customer retention rate measures the ability of a business to retain its existing customers over a specific period. It is much more cost-effective to retain existing customers than to acquire new ones, as the probability of selling to an existing customer is higher compared to a new prospect.
Let’s consider a scenario where a software company has a high customer retention rate of 85%. It means that 85% of their existing customer base continues to renew their subscriptions or purchase additional services. The high retention rate indicates a high level of customer satisfaction and trust in the company’s support services.

Best practices:
Agent utilization rate helps CXOs or heads of support to understand how effectively agents are being utilized. The help desk metric gives the leaders an idea of whether they are using their resources efficiently to handle customer inquiries and resolve issues promptly.
Let’s take an example of a help desk team that has 10 agents available to handle customer queries. If the agent utilization rate is low, around 40%, it indicates that the agents are not fully engaged. The result would be longer response times and dissatisfied customers. If the rate is high around 80% it indicates that the agents are efficiently managing their workload.

The formula of Agent Utilization Rate = (Total Handle Time / Total Available Time) x 100
Best practices:
Staffing prediction allows businesses to effectively allocate resources and ensure efficiency in meeting customer demands. They can avoid overstaffing or understaffing by accurately forecasting staffing needs, which can result in poor customer service and increased costs.
The formula for staffing prediction is typically based on historical data, such as customer volume, wait times, and agent productivity. Analyzing such data allows brands to identify patterns and trends to forecast the number of agents needed to handle future customer demands accurately.
Best practices:
Performance Metrics
Performance metrics are the quantitative measurements used to evaluate the effectiveness and efficiency of processes, operations, or individuals within an organization. They give valuable insights into various aspects of performance and enable businesses to improve their strategies.
First Contact Resolution (FCR) measures the ability of a help desk to resolve customer issues in a single interaction, without the need for follow-up or escalation. FCR is a critical metric as it directly impacts customer satisfaction, reduces operational costs and enhances overall service efficiency.
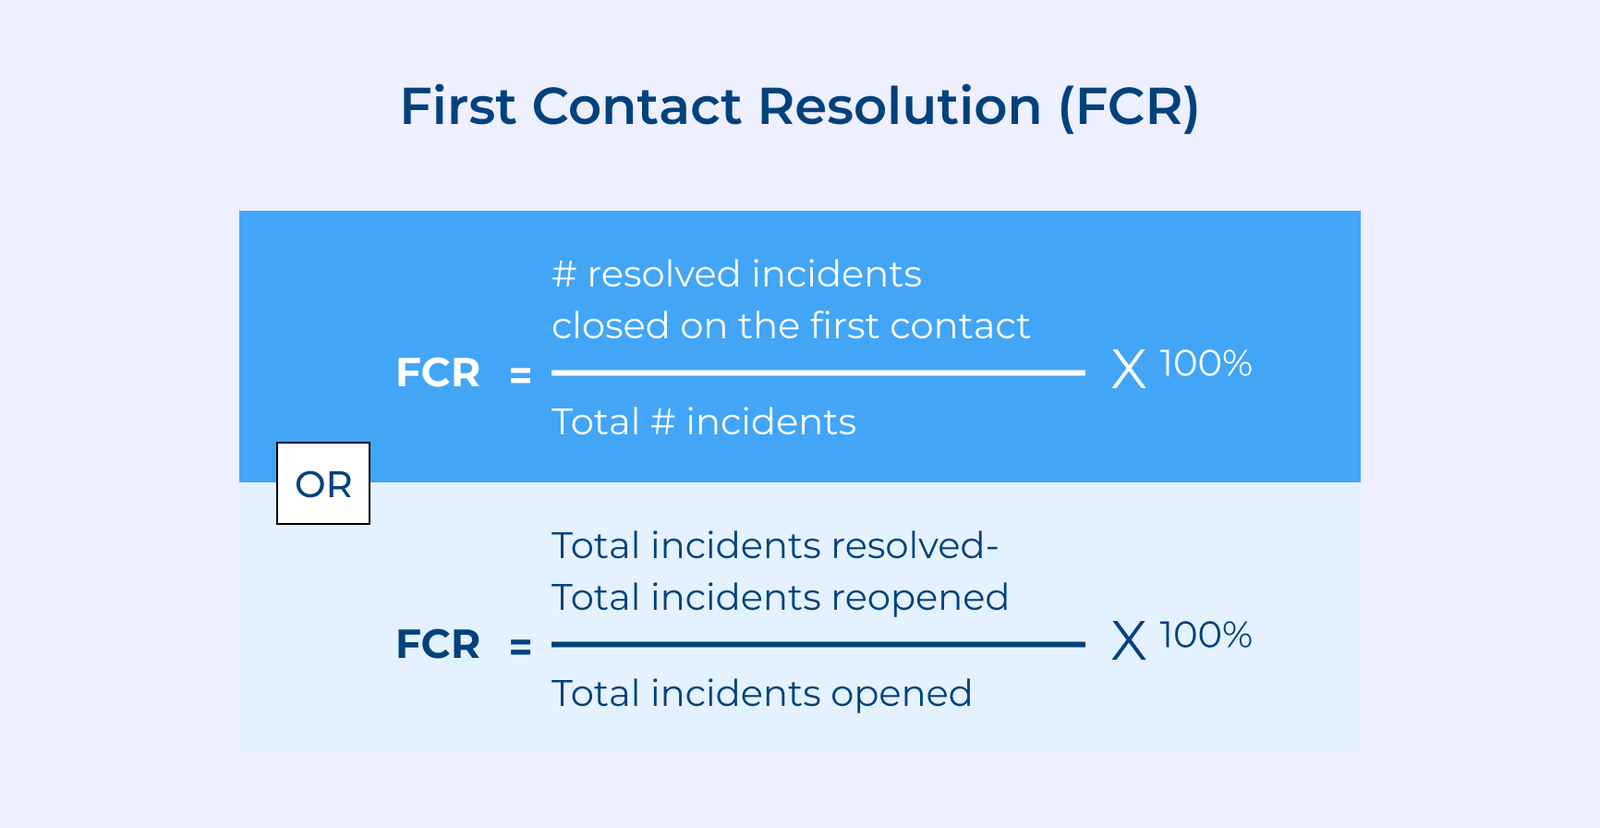
The formula to calculate First Contact Resolution rate is as follows:
FCR Rate = (Total number of issues resolved on first contact / Total number of issues received) * 100
Best practices:
The help desk metric first response time reflects the efficiency and effectiveness of customer support in providing timely solutions. It directly impacts customer satisfaction and loyalty. When it comes to social media, 85% of customers said they expect a company to respond within six hours.

The first response time is calculated by recording the timestamp of when the customer’s inquiry was received and comparing it to the timestamp of when the first response was sent to the customer. The difference between these two timestamps gives us the first response time for that particular interaction.
Best practices:
Resolution time reflects the efficiency of the help desk in addressing customer problems and meeting their needs in a timely manner. A shorter resolution time would mean a faster resolution for the customers and improve their overall satisfaction.
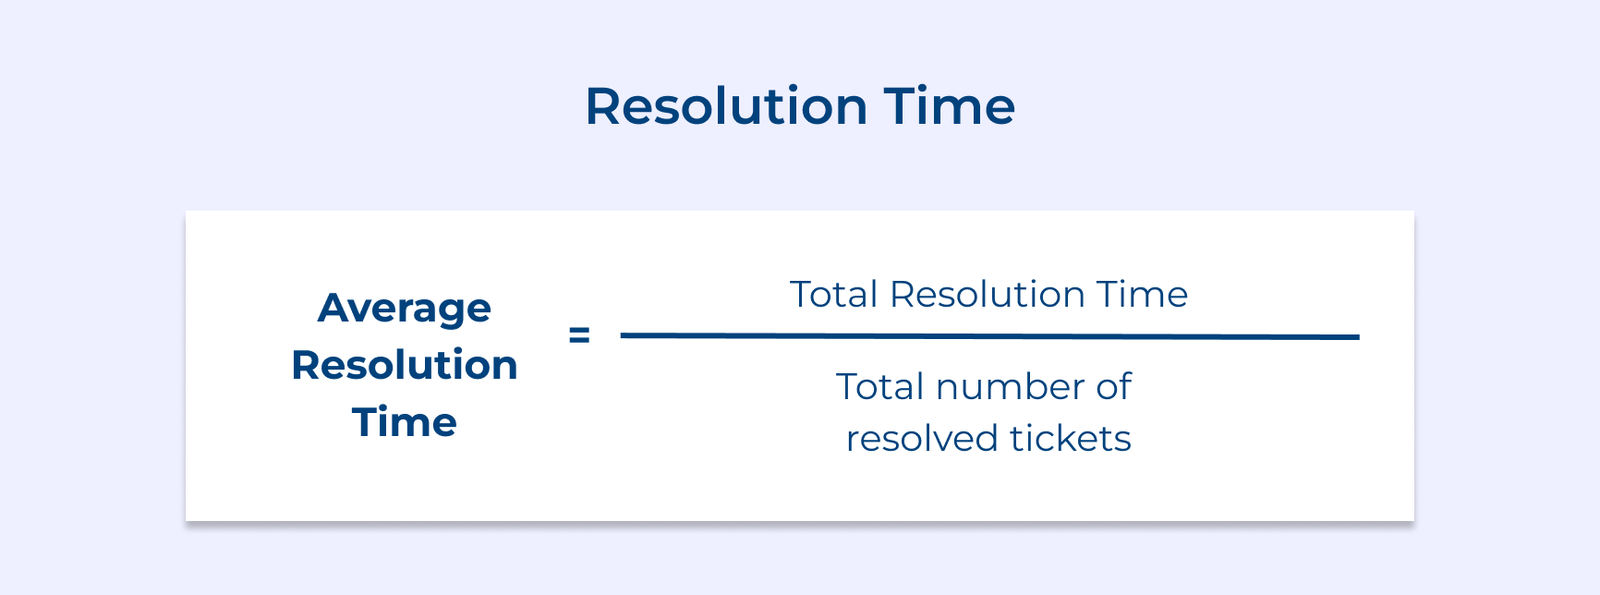
Resolution time is calculated by the difference between the time the ticket was opened and the time it was resolved. It provides a precise measurement of how long it took to resolve the customer’s issue.
Best practices:
Average Response Time (ART) measures the average time it takes for a help desk to respond to a customer’s query or issue. The metric is essential because it directly impacts customer satisfaction and the overall efficiency of the help desk. A timely response shows that the help desk values its customers and is committed to resolving their problems promptly.
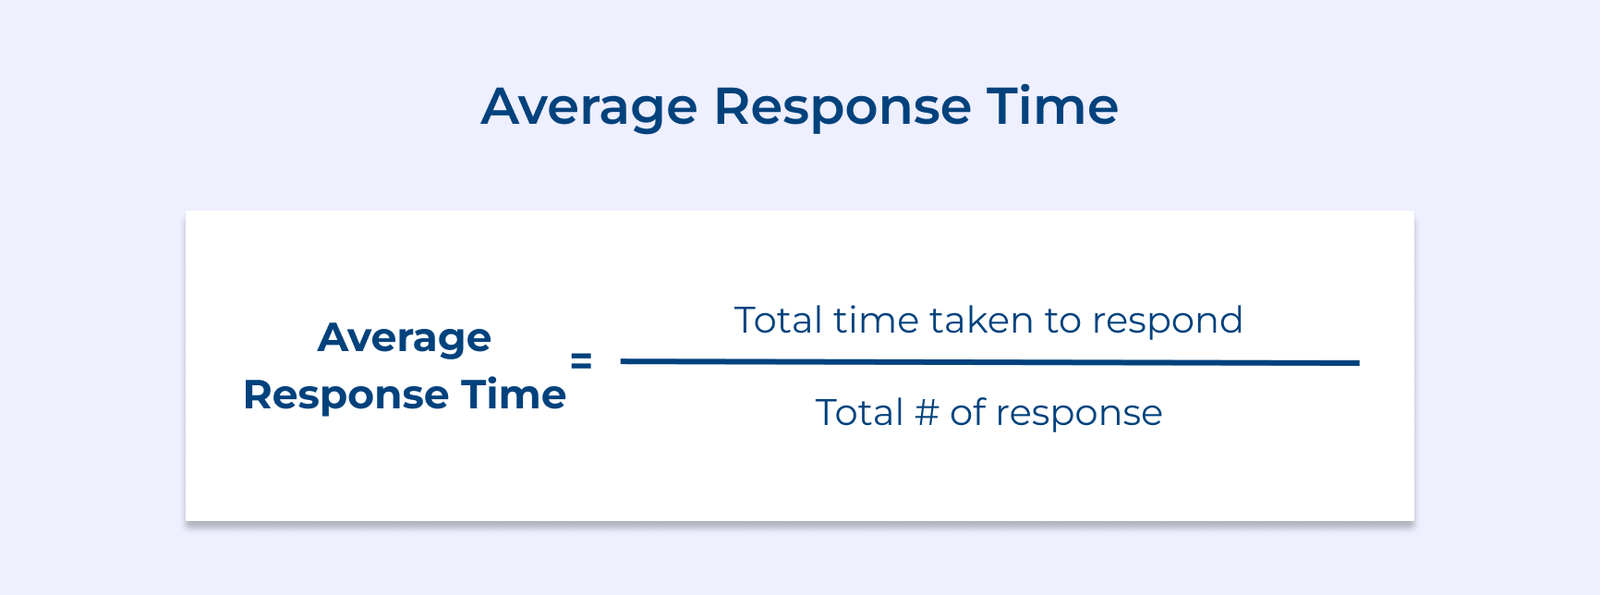
The average response time (ART) formula involves summing up the response times for all resolved queries and dividing the total by the number of queries. The result gives an average response time in the chosen unit of measurement, such as minutes or hours.
Best practices:
The self-service rate measures the percentage of issues that are resolved by customers themselves without the need for assistance from support agents. The metric is crucial as it reflects the effectiveness of self-service options provided by the help desk. Almost 60% of customers prefer self-service tools for simple issues.

The formula to calculate the Self Service Rate is
SSR = (Number of issues resolved by customers / Total number of issues) x 100
Best practices:
Quality Metrics
Quality metrics navigate the landscape of excellence in any business. They help businesses ensure everything stays top-notch and customers stay happy. They serve as the tools that help businesses be their best.
Customer satisfaction score helps brands measure the level of satisfaction their customers have with their products or services. They can identify areas of improvement and ensure that their customers are receiving the best possible support by monitoring CSAT.
Think of an example where a software company that recently released a new product. They can send out post-purchase CSAT surveys to customers asking about their satisfaction with the product and support received during the onboarding process. The feedback will help the company identify any issues, allowing them to address them promptly and provide a better customer experience.

The formula to calculate CSAT involves asking customers to rate their satisfaction on a scale, typically from 1 to 5 or from 1 to 10. The scores are then totaled, and the average score is derived by dividing the sum by the total number of responses. It gives a quantifiable measurement of customer satisfaction.
Best practices:
The Net Promoter Score (NPS) is an essential IT service desk metric and key performance indicator for any help desk or customer support team. It measures customer satisfaction and loyalty by asking a simple question: “On a scale of 0-10, how likely are you to recommend our company/product/service to a friend or colleague?”
Imagine an IT help desk that determines how satisfied its customers are with the support they receive by regularly measuring NPS. If the NPS is consistently low, it indicates that there are underlying issues that need to be addressed, such as long response times or unresolved problems. A high NPS signifies that customers are satisfied and likely to recommend the help desk to others.
NPS Formula: Categorize customers into three groups based on their rating: Promoters (score 9-10), Passives (score 7-8), and Detractors (score 0-6). Then, subtract the percentage of Detractors from the percentage of Promoters to obtain the NPS score. The score can range from -100 to +100.
Best practices:
Agent satisfaction measures the level of satisfaction and engagement of help desk agents. It directly impacts the quality of customer service they provide. When agents are satisfied and motivated, they are more likely to deliver exceptional customer support to boost customer satisfaction.
The formula to measure agent satisfaction can vary depending on the organization. The typical approach is to conduct regular surveys that assess agent satisfaction levels based on factors like job satisfaction, training opportunities, workload and recognition. The surveys can be scored on a scale or through open-ended responses, allowing agents to provide honest feedback.
Best practices:
Financial Metrics
Financial metrics are like health check-ups for businesses. They show how well a company is doing financially, covering things like money earned, profits and how smartly they invest. Businesses can make better decisions and grow stronger by keeping an eye on them.
Cost per ticket measures the average cost incurred for resolving a single support ticket. It provides insights into the efficiency and effectiveness of a help desk team’s operations. Measuring the cost per ticket helps to identify areas for improvement, optimize resource allocation and ultimately enhance the customer support experience.
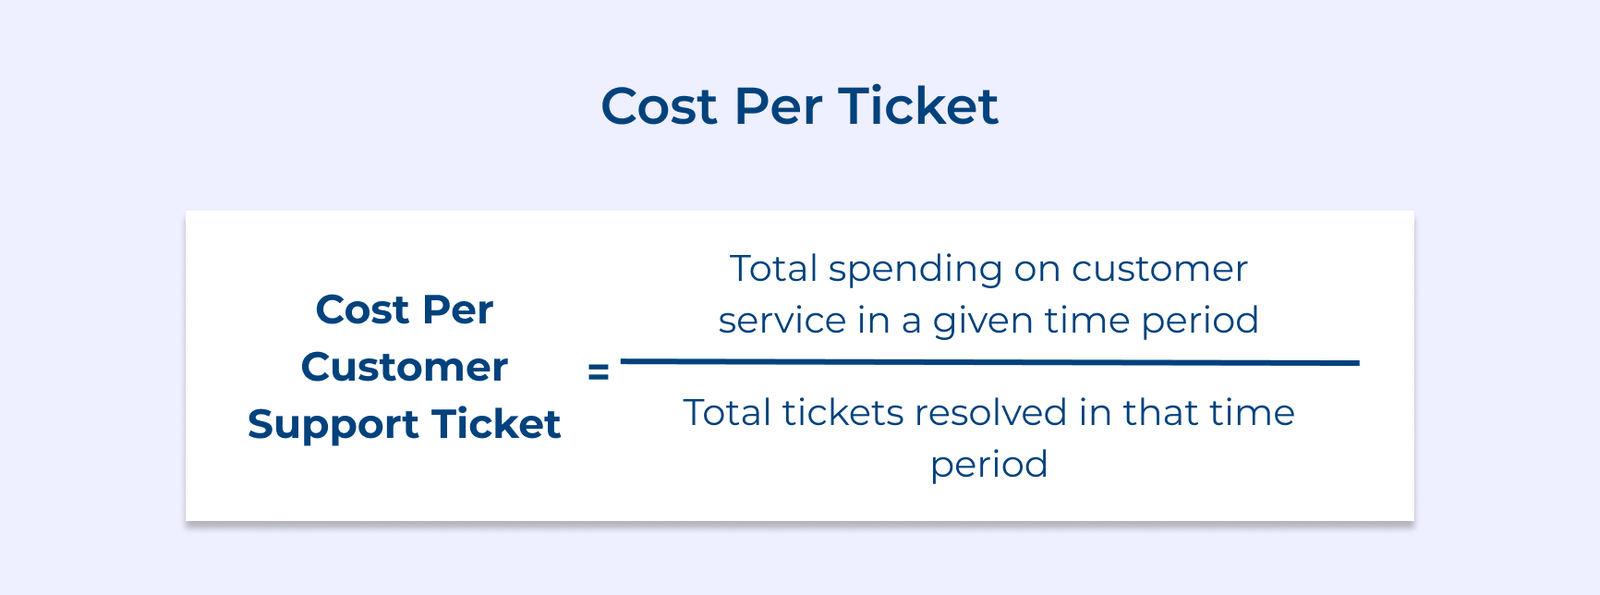
The formula involves dividing the total cost of providing support by the total number of tickets resolved within a given period. Assume if the total cost of support for a month is $10,000 and the help desk team resolves 500 tickets in that same month, the cost per ticket would be $20 ($10,000 divided by 500).
Best practices:
Return on Investment (ROI) focuses on determining the value and impact of the help desk efforts. It reflects whether the investment is delivering desirable outcomes and if the resources are being utilized optimally.
Let’s consider a help desk that implemented a new software system to streamline their ticketing process. They were able to assess the cost of the new software, the reduction in ticket resolution time and the resulting increase in customer satisfaction. The data allowed them to determine whether the investment was worthwhile and identify areas for improvement.

The formula for calculating ROI requires comparing the gain from the investment (e.g., cost savings, increased productivity) to the cost of the investment (e.g., software fees, training expenses).
ROI = (Gain from Investment – Cost of Investment) / Cost of Investment * 100.
Best practices:
Measuring help desk metrics isn’t just a good practice—it’s a smart business move. Why? Well, it makes the operations smoother. Faster response and resolution times mean the company is using the resources better, which ultimately saves it money.
Here’s the real deal: it’s not just about being good; it’s about getting better all the time. Businesses that keep an eye on the important metrics show they’re serious about improving. The practice of measuring service desk KPI isn’t just a nice-to-have; it’s the tool to get a competitive edge.
The definition of good performance can vary depending on industry standards and business goals. A good response time is around 24 hours or less, an ideal first-call resolution rate is above 80%, and an acceptable customer satisfaction score is above 85%. It is essential to set benchmarks based on your company’s unique objectives and continuously strive for improvement.
Regular analysis of help desk metrics is significant for staying on top of performance trends and identifying areas for improvement. It is recommended to review the metrics on a monthly or quarterly basis. Depending on the urgency of certain issues or the need for immediate changes, you may need to review them more frequently.
Yes, help desk metrics can be used for performance evaluation purposes. Managers can assess performances accurately by monitoring metrics like resolution time, customer satisfaction, and ticket backlog. The metrics provide an objective basis for developing training programs to enhance overall help desk performance.
Regularly reviewing help desk KPIs is crucial to track progress and make necessary adjustments. The frequency of reviewing KPIs may vary depending on the organization and its goals, but it is recommended to review KPIs at least every month. The frequency allows you to identify trends, spot issues, and implement changes promptly.
Brands can identify areas for improvement and implement targeted strategies to enhance their performance by regularly analyzing help desk KPIs. The metrics can help identify training needs, optimize processes, allocate resources effectively and ultimately improve customer satisfaction. They give the company a clear idea of where they stand regarding their customer experiences.
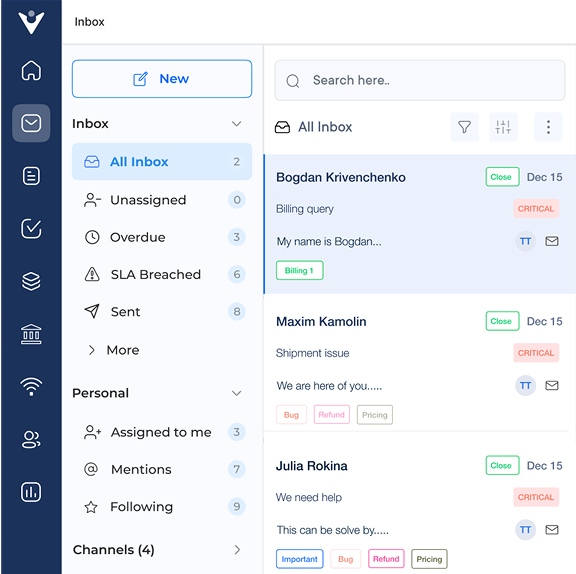
Market better, sell faster and support smarter with Veemo’s Conversation Customer Engagement suite of products.
Unify all your customer data in one platform to deliver contextual responses. Get a 360 degree view of the customer lifecycle without switching tools.
Connect with the tools you love to reduce manual activities and sync your business workflows for a seamless experience.
 https://veemo.io/wp-content/uploads/2025/12/customer-connection.png
1256
2400
indrasish5342@gmail.com
https://veemo.io/wp-content/uploads/2024/11/veemo.svg
indrasish5342@gmail.com2026-02-06 09:11:372026-01-19 09:14:05What is Customer Connection: Mistakes, Metrics & Examples
 https://veemo.io/wp-content/uploads/2025/12/complaint-management.png
1256
2400
indrasish5342@gmail.com
https://veemo.io/wp-content/uploads/2024/11/veemo.svg
indrasish5342@gmail.com2026-02-03 09:04:022026-01-19 09:10:02What is Complaint Management? Importance, Key Steps & Strategies
 https://veemo.io/wp-content/uploads/2025/12/AI-Self-Service.png
1256
2400
indrasish5342@gmail.com
https://veemo.io/wp-content/uploads/2024/11/veemo.svg
indrasish5342@gmail.com2026-01-26 09:52:482026-01-13 10:17:07What is AI Self Service? Benefits, Key Metrics and Best Practices
https://veemo.io/wp-content/uploads/2025/12/AI-Self-Service.png
1256
2400
indrasish5342@gmail.com
https://veemo.io/wp-content/uploads/2024/11/veemo.svg
indrasish5342@gmail.com2026-01-26 09:52:482026-01-13 10:17:07What is AI Self Service? Benefits, Key Metrics and Best PracticesGrow Customer Relationships and stronger team collaboration with our range of products across the Conversational Engagement Suite.

 What is Proactive Customer Service and How to Implement it?
Scroll to top