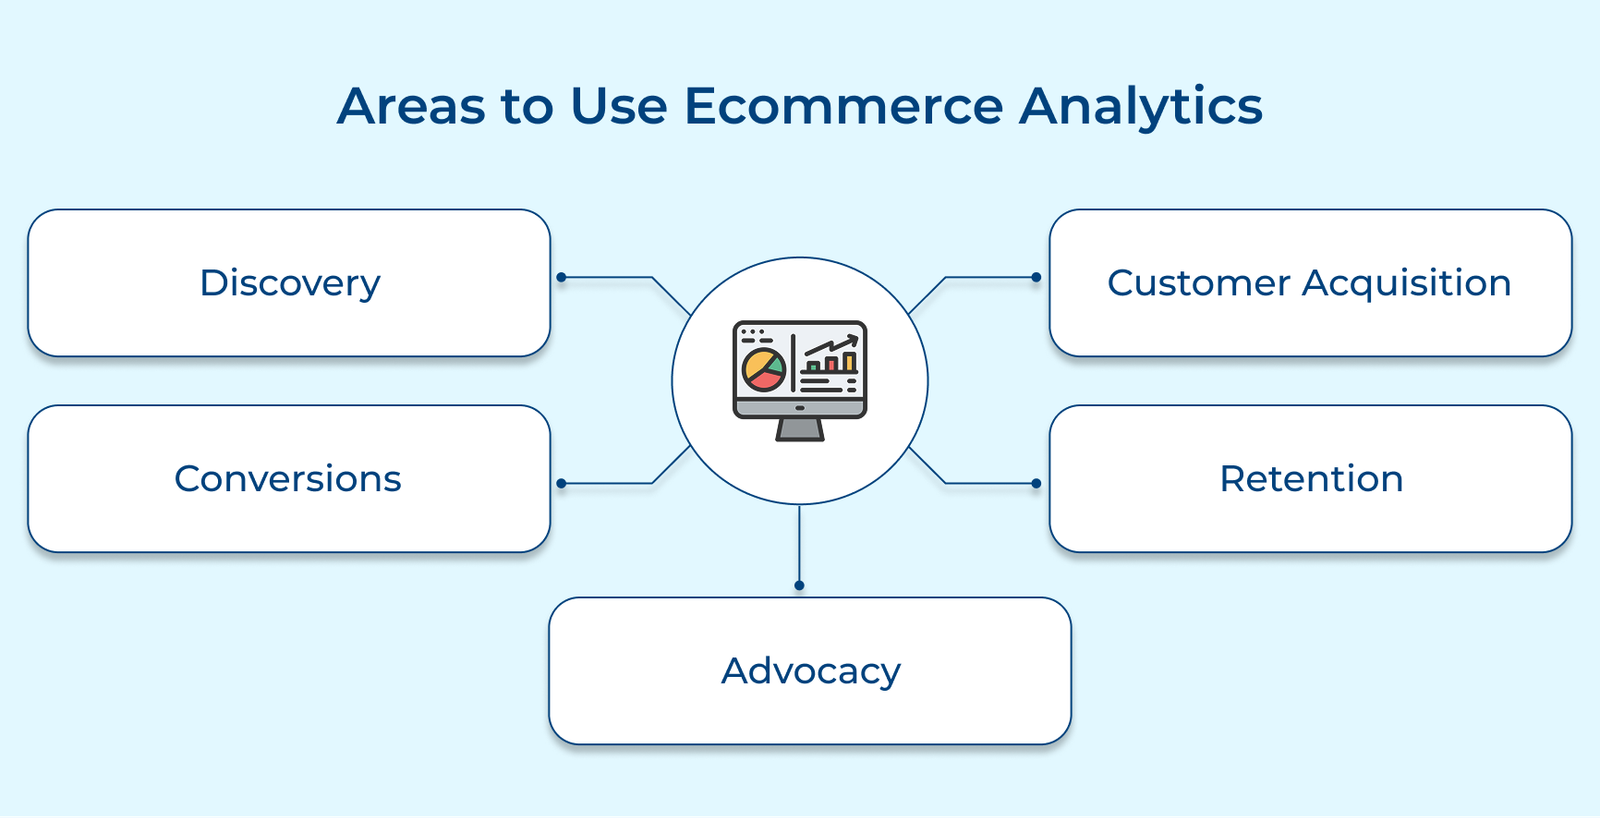
Discovery
Understanding how new visitors engage with your store helps you shape better first impressions and use your marketing resources more wisely. Analytics during this phase highlights which channels bring in people who are likely to stick around, not just click and leave.
The metric shows where your visitors come from like Google searches, Instagram ads, direct links or third-party referrals. But it’s not just about volume. It’s about which sources bring in people who engage.
If visitors from one platform spend more time on your site or are more likely to buy, that’s where your focus and budget should go. Let’s say Instagram visitors view more pages and convert more often than those from Facebook. It’s a clear sign to invest more in Instagram content or promotions.
Bounce rate tracks the percentage of visitors who leave your site after viewing only one page without taking any action. It indicates if your landing pages effectively engage new visitors or if something is turning them away before they explore further.
(Number of single-page sessions / Total number of sessions) × 100%
If your mobile bounce rate sits around 75 percent while desktop is closer to 40 percent, that gap says a lot. Your mobile experience probably needs work. Maybe the pages load slowly or the layout just doesn’t hold up on a phone. Either way, it signals a fix worth prioritizing.
Customer Acquisition
Turning casual visitors into paying customers isn’t just about getting more traffic; it’s about understanding which marketing efforts lead to purchases. Analytics helps you separate channels that bring real value from those that simply generate noise, so you can spend smarter and grow sustainably.
-
Customer Acquisition Cost (CAC)
CAC tells you how much it costs to gain one new customer, factoring in everything from ad spend to team salaries. It’s a clear way to judge if your marketing is efficient or eating into your margins.
Formula: Total marketing and sales\ Number of new customers acquired during the same period
Not all marketing is equal; businesses need to understand which channels are worth the money. It compares revenue generated to what you spent, so you can double down on what works and drop what doesn’t.
Formula: (Revenue generated from channel – Cost of channel) / Cost of channel × 100%
Let’s break it down with a simple example. An email campaign costs $1,000 and brings in $5,000, giving you an ROI of 400 percent. Social ads cost $2,000 and bring in $4,000, so the ROI sits at 100 percent. Once you see numbers like that, shifting more budget toward email feels like the smarter move.
-
Conversion Rate by Acquisition Channel
The metric shows which channels not only bring visitors, but bring the right visitors – those who buy.
If organic search brings in 5 percent of buyers while social media brings in only 2 percent, it makes sense to put more energy into SEO. Focus on content that answers purchase-ready questions instead of posts that only build early awareness.
Conversions
The point where someone goes from browser to buying is often where the real challenge begins. It is about reducing hesitation and making it as rewarding as possible to complete a purchase. Analytics helps pinpoint exactly where shoppers drop off and how to encourage larger orders once they commit.
-
Checkout Abandonment Rate
The KPI measures the percentage of shoppers who begin the checkout process but leave before completing their purchase. High abandonment signals problems in your checkout flow that could be costing you significant revenue through nearly-completed sales.
Formula: (Number of abandoned checkouts / Number of initiated checkouts) × 100%
-
Average Order Value (AOV)
AOV tells you how much the average customer spends per purchase. It’s a key number to watch if you want to grow revenue without needing more customers.
Formula: Total revenue / Number of orders
Let’s consider that if your data shows customers who view product recommendations have a 20% higher AOV than those who don’t, you might make these recommendations more prominent throughout the shopping experience to boost average spend.
Retention
Keeping existing customers coming back costs significantly less than acquiring new ones and builds a sustainable revenue base. Analytics helps identify at-risk customers, recognize loyalty patterns, and measure the long-term value each customer brings to your business.
-
Customer Lifetime Value (CLV)
CLV predicts the total revenue a customer will generate throughout their relationship with your store. This forward-looking metric helps determine how much you can sustainably spend on acquisition and retention for different customer segments.
Formula: Average order value × Average number of purchases per year × Average customer lifespan in years
The metric shows how many of your customers stick around and make more than one purchase. It’s a clear sign of people valuing your store enough to return. A strong repeat purchase rate means you’re not constantly starting from scratch to drive sales.
(Number of repeat customers ÷ Total customers) × 100
Let’s consider that if people buying skincare return far more than makeup buyers, it may be time to offer product bundles or helpful content that turns one-time makeup shoppers into regulars.
The metric tells you how many customers walk away and stop buying from your store. A rising churn rate means your business is losing ground and probably spending more to replace each lost customer. Understanding when people leave and why helps you act before it’s too late.
Formula: (Customers at start of period – Customers at end of period) / Customers at start of period × 100%
Let’s assume that if data shows customers typically churn after three months without a purchase, you might set up automated email campaigns at the two-month mark with personalized offers based on their previous purchase history.
Advocacy
Turning customers into advocates means going beyond satisfaction. It’s about building trust deep enough that people willingly promote your brand. Analytics doesn’t just measure success, it uncovers how word-of-mouth actually spreads.
NPS tells you how likely your customers are to recommend you. It’s a quick pulse check on loyalty and long-term potential.
Formula: Percentage of Promoters (9-10 scores) – Percentage of Detractors (0-6 scores) = NPS
Let’s say 60 percent of your customers give you a 9 or 10, 25 percent land at 7 or 8, and 15 percent rate you between 0 and 6. Your NPS comes out to 45. Tracking this number over time shows how your customer experience efforts shape loyalty and advocacy.
-
User-Generated Content Engagement
The metric looks at how often customers actively talk about your brand. It can be anything from leaving a review to tagging you on social media or sharing a personal story. Strong engagement here isn’t just noise; it shows genuine interest and signals that your brand resonates on a personal level.
Formula: Measure the volume of user content (reviews, social mentions) and engagement metrics (likes, shares, comments) related to your brand.
Imagine your analytics show that products with more than 20 reviews sell about 250 percent more. That kind of insight can inspire a post-purchase email flow that nudges customers to share thoughtful feedback and reviews.
What are the Benefits of Ecommerce Analysis?
Below are the key benefits of utilizing ecommerce analysis, revealing how they can transform your enterprise from merely surviving to thriving in it.