Top 11 SaaS Marketing Metrics & KPIs to Track in 2026
The blog explains the most important SaaS marketing metrics and why they matter. Understand how to improve acquisition, retention, revenue growth and decision-making across your marketing funnel.

The blog explains the most important SaaS marketing metrics and why they matter. Understand how to improve acquisition, retention, revenue growth and decision-making across your marketing funnel.
Businesses pour thousands into marketing every month, yet there is no clear answer on what is actually driving returns and what is quietly eating into your budget. Teams end up celebrating surface-level numbers like website traffic while cash reserves shrink and customer acquisition costs continue to climb without control.
When businesses know what SaaS marketing metrics and KPIs they should be looking at, it is only then that they can understand which efforts contribute to real revenue. Below in the guide, we’ll break down the most vital metrics with simple formulas and practical examples you can start using right away.
B2B SaaS marketing metrics refer to measurable data points that track how well your company attracts and converts business customers. They reveal which channels bring quality leads, which waste budget and if your marketing spend is delivering tangible results.
The metrics directly shape your company’s survival and growth trajectory. They show if you’re acquiring customers efficiently or burning cash without meaningful returns. Smart tracking prevents you from making expensive guesses about what works.
Key factors:
Let’s go through why B2B SaaS marketing KPIs matter. They show what’s working and where to focus so your marketing efforts actually drive dependable, long-term growth.
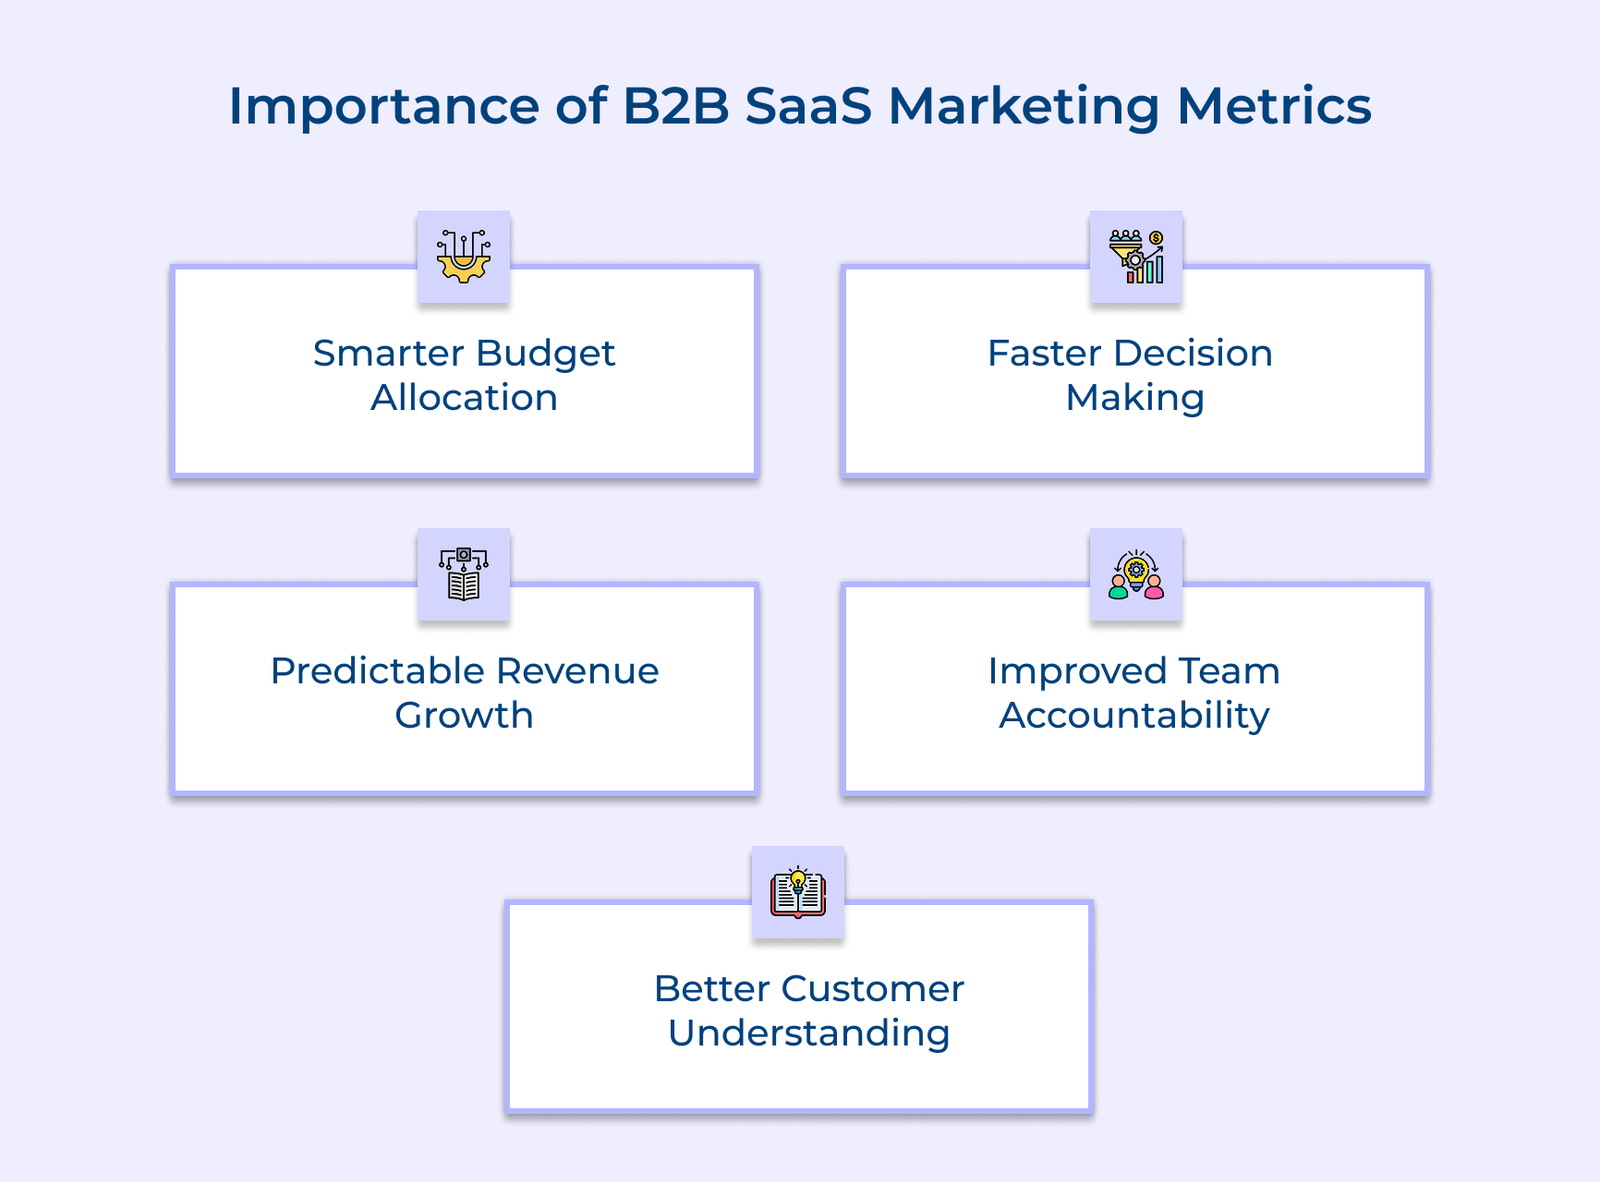
Smarter Budget Allocation
Metrics show which channels actually bring paying customers and which ones drain money. You can redirect the budget toward what works so every rupee supports real results.
Faster Decision Making
Real-time data lets you spot problems and opportunities before they become major issues that cost you months of progress. You can pivot campaigns quickly when something isn’t working instead of waiting for quarterly reviews. The agility keeps you ahead of competitors who move more slowly.
Predictable Revenue Growth
Clear patterns in your numbers help you forecast revenue with confidence. You know how many leads turn into customers and how long that journey takes, making planning far less stressful.
Improved Team Accountability
Metrics give each team member specific targets tied to their daily work. Marketing understands their conversion goals and sales know their close-rate expectations. Everyone sees their role in driving growth.
Better Customer Understanding
Your data shows which customer groups respond to your message, which features attract attention and where prospects hesitate. The insights help you refine your product and communication to match real user needs.
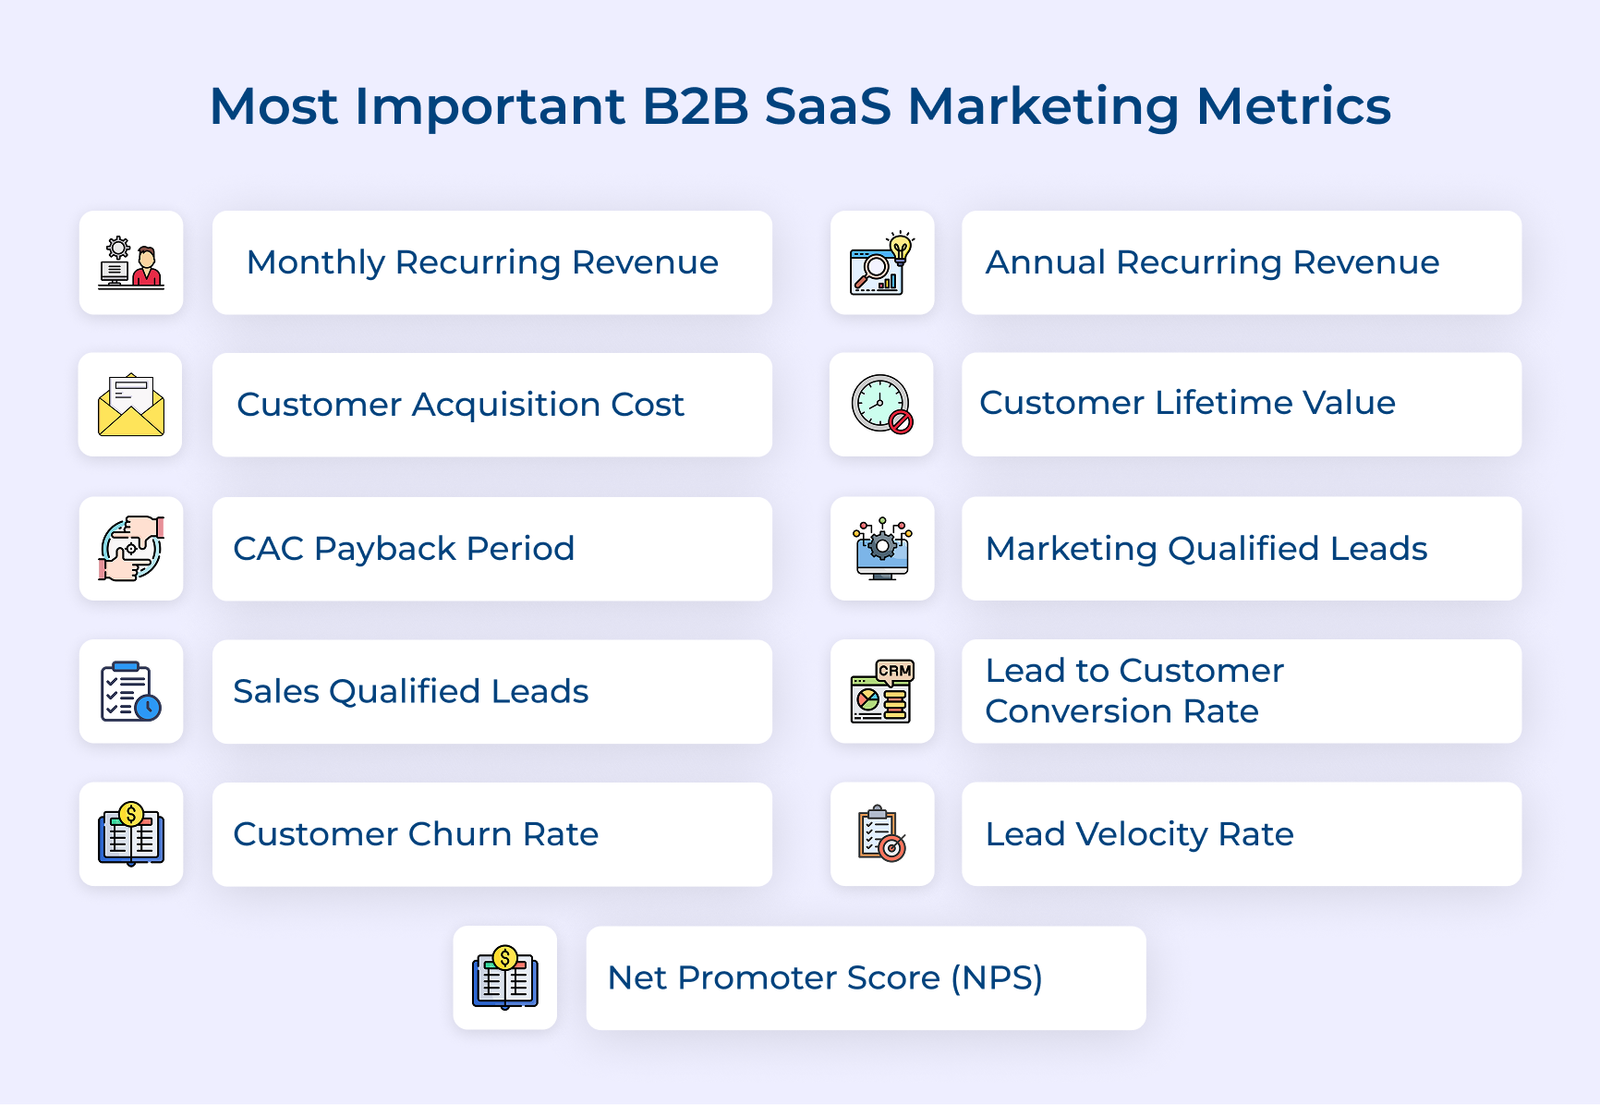
Check out the most important SaaS marketing metrics and KPIs that every B2B SaaS company should focus on to ensure sustainable success.
MRR measures your predictable monthly income from all active subscriptions. The metric matters because it shows if your business is growing or shrinking month over month. Tracking MRR helps you make confident decisions about hiring and spending.
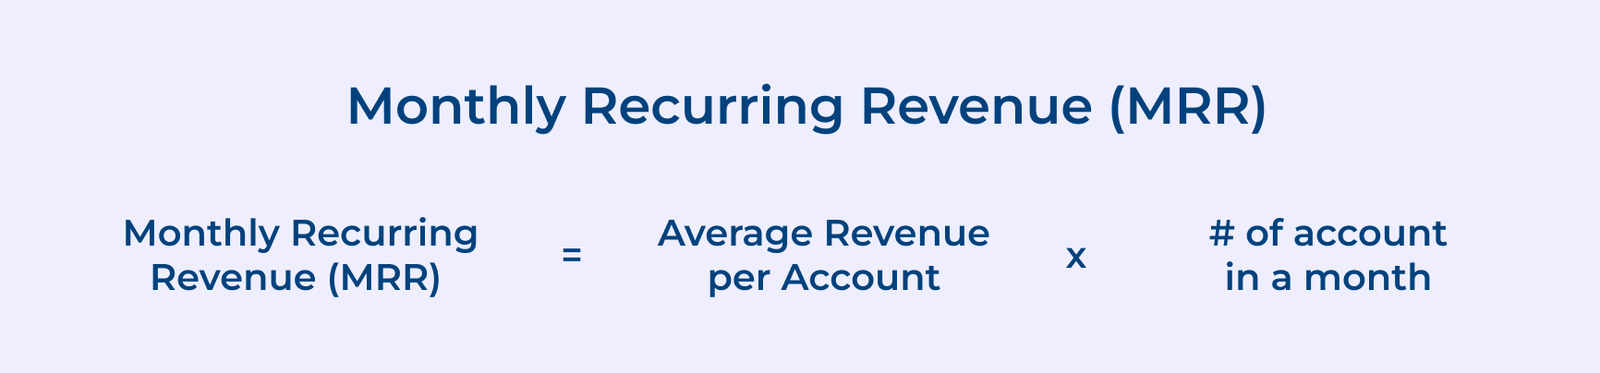
MRR = Number of Customers × Average Revenue Per Account
You multiply your total paying customers by what they pay you on average each month. It gives you a clear snapshot of your baseline revenue that you can count on.
Imagine you have 50 customers and each pays $200 monthly on average. Your MRR would be $10,000. The number tells you exactly what cash flows in each month before any new sales.
Key stages:
ARR is one of the most vital SaaS marketing metrics as it tells you how much subscription revenue you can count on each year. It’s one of the clearest indicators of your company’s stability and long-term growth. Investors, founders, or leadership teams rely on ARR to understand how quickly the business is expanding and how predictable future revenue looks.
Formula: ARR = MRR × 12
Pro tips:
Healthy ARR benchmarks vary, but most successful B2B SaaS companies aim for at least 100% year-over-year growth in early stages. As companies mature past $10 million ARR, growth rates typically stabilize between 40-60% annually, depending on market conditions.
Imagine your MRR is $50,000 at the end of March, you simply multiply by 12 to get $600,000 ARR. It gives investors and your team a clear picture of your annual run rate.
CAC measures how much you spend to win a single new customer, including all marketing and sales expenses. You need the metric because spending more to acquire customers than they’ll ever pay you creates a death spiral. Smart CAC tracking prevents you from scaling unprofitable growth.
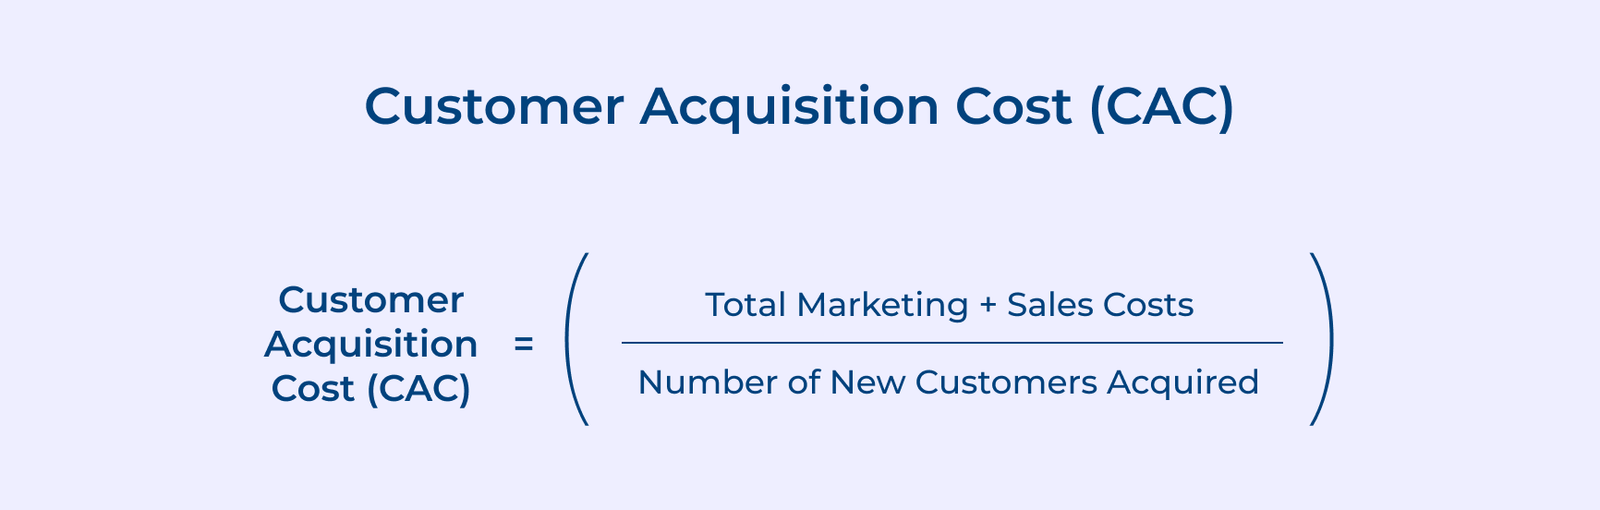
A good CAC benchmark for B2B SaaS is recovering your acquisition cost within 12 months of customer signup. Companies with strong unit economics typically maintain a 3:1 ratio of customer lifetime value to CAC.
Key ways:
Focus on improving conversion rates at every funnel stage since converting more leads from the same traffic naturally lowers your cost per customer. You can also invest in channels with better long-term returns, like content marketing and customer referrals, instead of relying heavily on paid ads.
CLV tells you how much total revenue a customer brings in over the entire time they stay with your product. If you ignore SaaS metrics like these, you’ll either overspend on acquisition or overlook customers who could drive long-term revenue. It prevents guesswork and keeps your spending aligned with real customer value.
You use CLV to set smart acquisition budgets and identify which customer segments deserve more attention and resources. The metric also helps you decide when to invest in customer retention programs versus new acquisition.
Formula: CLV = (Average Revenue Per Account × Gross Margin %) ÷ Churn Rate
Divide your monthly revenue per customer by your churn rate and multiply by gross margin percentage. A healthy benchmark is maintaining at least a 3:1 ratio of CLV to CAC. It ensures you earn back three dollars for every dollar spent acquiring customers.
Pro tips:
CAC payback period shows how many months it takes to recover what you spent acquiring a customer through their subscription payments. Tracking the metric matters because it reveals your cash flow health and tells you if your growth is financially sustainable or burning through capital dangerously fast.
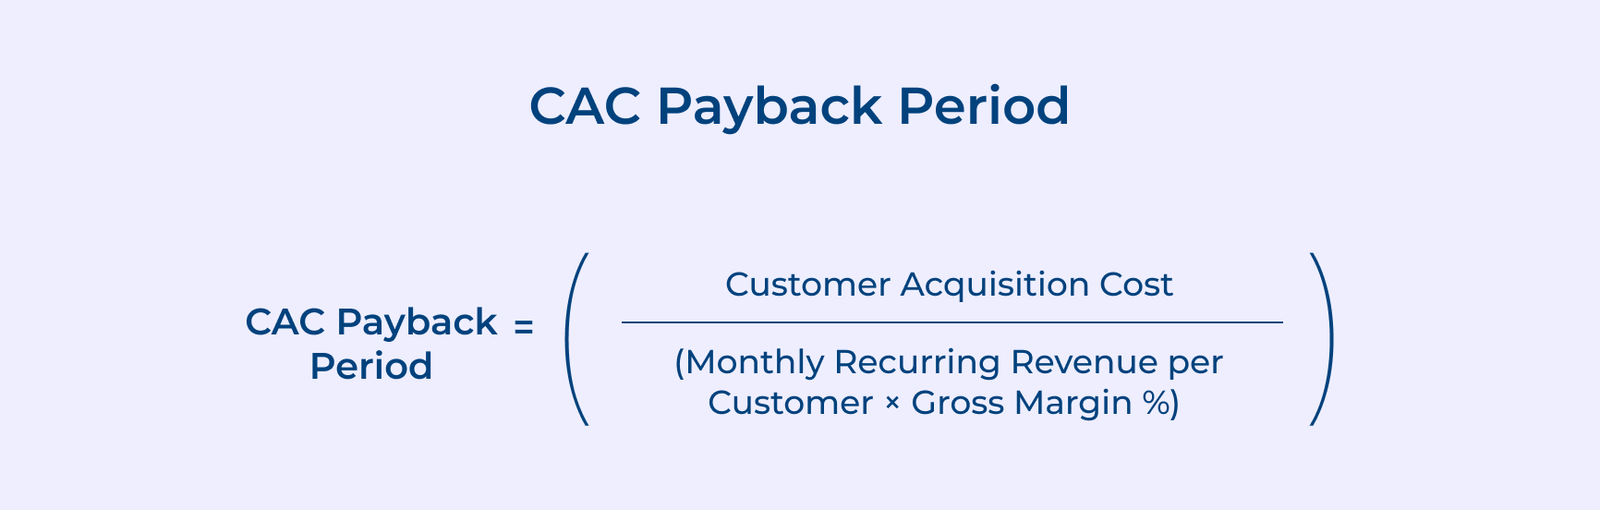
A healthy benchmark for B2B SaaS is recovering CAC within 12 months or less. Divide your total acquisition cost by the gross margin-adjusted monthly revenue each customer generates. Companies with payback periods under 12 months can typically grow without constantly raising outside capital.
Actionable tips:
The biggest pitfall is focusing only on reducing CAC without considering if you’re acquiring quality customers who actually stick around. You avoid the risk by tracking CAC Payback together with retention metrics so you’re not speeding up payback at the cost of attracting customers who leave quickly.
An MQL is a prospect who has shown enough interest to signal they’re ready for a sales conversation. Tracking the metric keeps teams aligned and helps you see which campaigns actually attract people who might buy, not just people who click around.
You use MQLs to track marketing performance and shift budget toward channels that consistently produce leads sales can actually work with. The metric also helps you forecast pipeline and revenue by tracking how MQLs move through your funnel over time.
Key stages:
The SaaS metrics like these generally don’t have a formula, but you can measure them by defining specific engagement criteria that indicate purchase intent. You might count someone as an MQL when they download multiple resources, attend a webinar and visit your pricing page within 30 days. Each company sets its own criteria based on what behaviors historically predict conversion.
An SQL is a lead sales has confirmed as a real opportunity based on budget, authority, need and timing. The metric matters because it shows how many serious deals are entering your pipeline and helps you predict revenue with more confidence.
Key takeaways:
Most B2B SaaS companies see 20-30% of their MQLs become SQLs after sales qualification. If you’re converting much lower than 20%, your marketing might be attracting the wrong audience or setting unrealistic expectations about your product capabilities.
Key ways:
Lead-to-customer conversion rate shows the percentage of leads that eventually become paying customers. It gives you a clear sense of how well your entire funnel works from first touch to closed deal and highlights where prospects lose interest or get stuck.
Formula: Lead to Customer Conversion Rate = (Number of New Customers ÷ Total Number of Leads) × 100
Key ways:
Most B2B SaaS companies convert 5–10% of leads into customers, though the range depends on sales complexity. Enterprise cycles often convert lower (2–3%), while product-led models can hit 10–15% from trial to paid.
If you generate 500 leads in a quarter and 35 become paying customers, your conversion rate is 7%. You calculate it by dividing 35 by 500 and multiplying by 100 to get your percentage.
Key approaches:
Customer churn rate measures the percentage of customers who cancel their subscriptions during a specific period, like a month or quarter. High churn cancels out your growth and signals deeper product or service issues that need attention before they become serious.
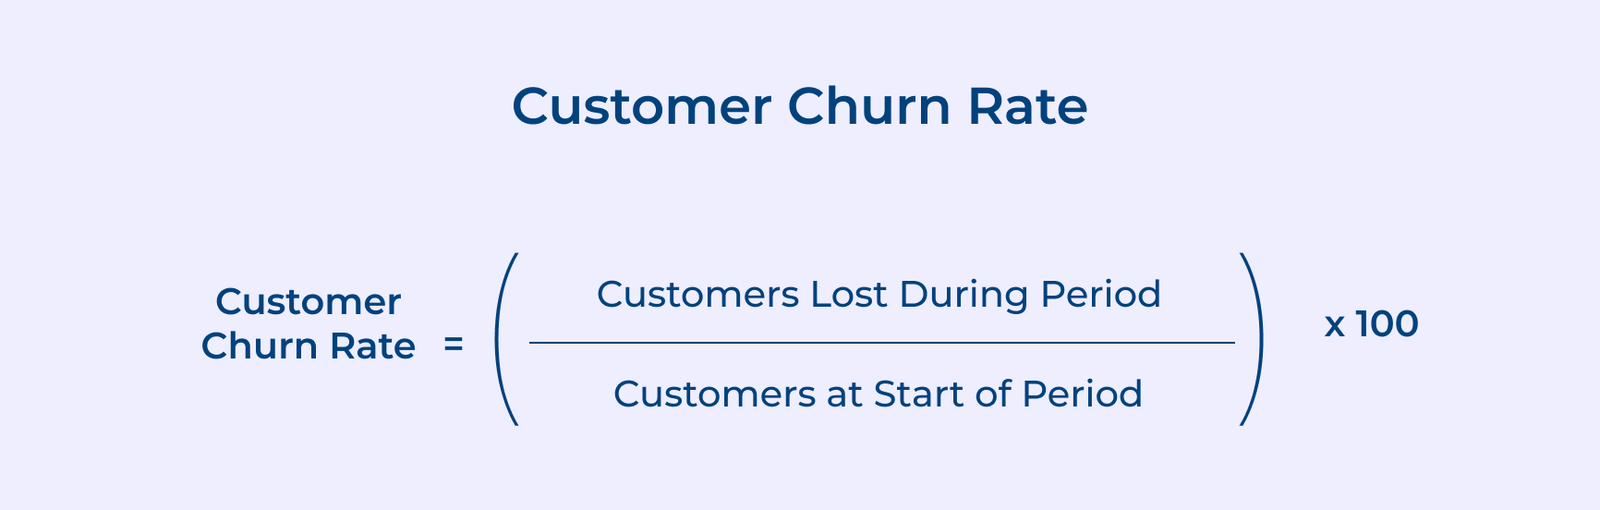
You divide the number of customers who left by the number you had at the beginning of your measurement period. Then multiply by 100 to express it as a percentage that’s easy to track and compare over time.
Let’s assume that you start January with 200 customers and lose 10 by month’s end. Your monthly churn rate equals 10 divided by 200, which gives you 0.05 or 5% churn. If this continues monthly, you’d lose more than half your customer base within a year, which would require aggressive acquisition just to stay flat.
Pro tips:
NPS measures how satisfied your customers are and how likely they are to recommend your product on a simple 0–10 scale. It’s useful because it highlights if people genuinely value your product and alerts you to issues before they turn into churn.
The metric uses a simple 0–10 survey asking, “How likely are you to recommend us to a colleague?” The score places each customer into a category and shows how they truly feel about your product.
Key groups:
A good NPS benchmark for B2B SaaS is scoring above 30, with excellent companies reaching 50 or higher. You calculate your final NPS by subtracting the percentage of detractors from the percentage of promoters while ignoring passives entirely in the math.
Lead velocity rate shows how quickly your pool of qualified leads is growing each month. It’s one of the earliest signals of future revenue, giving you a read on momentum long before deals close.
Lead Velocity Rate = (Qualified Leads This Month – Qualified Leads Last Month) ÷ Qualified Leads Last Month) × 100
Double down on top-performing channels instead of spreading resources thin, as focusing on what works drives faster, compounded growth. Test new channels with small budgets first, then scale to sustain growth as top channels mature.
The biggest pitfall is chasing lead volume growth while ignoring if the leads actually convert into revenue down the funnel. You overcome it by tracking lead velocity separately for different lead quality tiers, so you’re measuring growth in SQLs or MQLs rather than just raw unqualified contact numbers.
Key ways:
Tracking the metrics gives you a complete picture of your marketing performance and business health. You’ll know exactly where money flows in and leaks out. The numbers turn guessing into strategic decisions that compound your growth over time.
Start with the metrics that match your current stage and challenges instead of tracking everything at once. Focus on improving two or three key numbers each quarter. Your consistent attention to the metrics will separate your company from competitors who fly blind and wonder why growth stalls unexpectedly.

Start with the essentials, including MRR, CAC, CLV, churn rate and lead conversion rates. The core numbers show your growth trajectory. Once you master them, expand to more specialized metrics based on your stage and business goals.
You track marketing metrics by connecting your CRM, billing system and analytics tools to create a single dashboard that updates automatically. Most companies use platforms like HubSpot or Salesforce combined with spreadsheets to calculate and monitor their key performance indicators consistently each month.
B2B SaaS marketing metrics matter because enterprise sales cycles are long and expensive so you need early signals about what’s working. The metrics reveal problems before they hurt revenue and show which strategies are ready to scale with your target customers.
Grow Customer Relationships and stronger team collaboration with our range of products across the Conversational Engagement Suite.
Omnichannel Customer Support & Help Desk Software
AI Enabled Business Messaging and Chatbot Software
Sales Engagement & CRM Software
Call Center Software & Virtual Phone System
Product Marketing & Experience Platform
Customer Experience & Feedback Management Software
 On Premise vs Cloud CRM: A Detailed Guide in 2026
Scroll to top
On Premise vs Cloud CRM: A Detailed Guide in 2026
Scroll to top