What is Customer Effort Score & How to Measure It?
Customer effort score measures how easy it is for customers to interact with your business. Lower effort leads to higher satisfaction, stronger loyalty and better customer retention over time.

Customer effort score measures how easy it is for customers to interact with your business. Lower effort leads to higher satisfaction, stronger loyalty and better customer retention over time.
Most businesses measure how happy their customers are. Very few measure how hard they make it for customers to get what they need and that gap is where revenue quietly disappears.
Do you think a customer who resolves an issue after three calls, two transfers and a chatbot that understands nothing will not complain loudly? No, they’ll simply leave and will tell people why.
Customer effort score exists because satisfaction alone was never the full picture. A customer can walk away from an interaction feeling satisfied and still find the experience exhausting enough to reconsider the relationship.
What they remember is not whether your support team was polite; it is how much of their time and energy the interaction consumed. That memory is what drives the decision to stay or leave far more reliably than any post-call satisfaction rating ever could. A study found that of those with a good CES, 94% expressed an intention to repurchase and 88% said they would increase their spending.
Customer effort score refers to the measurement of how easy or difficult it is for someone to complete a specific interaction with your company. It captures the friction people experience when trying to get help, make a purchase or resolve an issue. The metric typically uses a simple survey question asked right after an interaction.
The score highlights friction in everyday interactions. Long wait times, repeated explanations and unclear instructions increase effort. Customers remember those moments. High effort often leads to frustration and eventual churn.
Key factors:
Let’s go through the main pros and cons of customer effort score to understand how the metric can help simplify experiences.
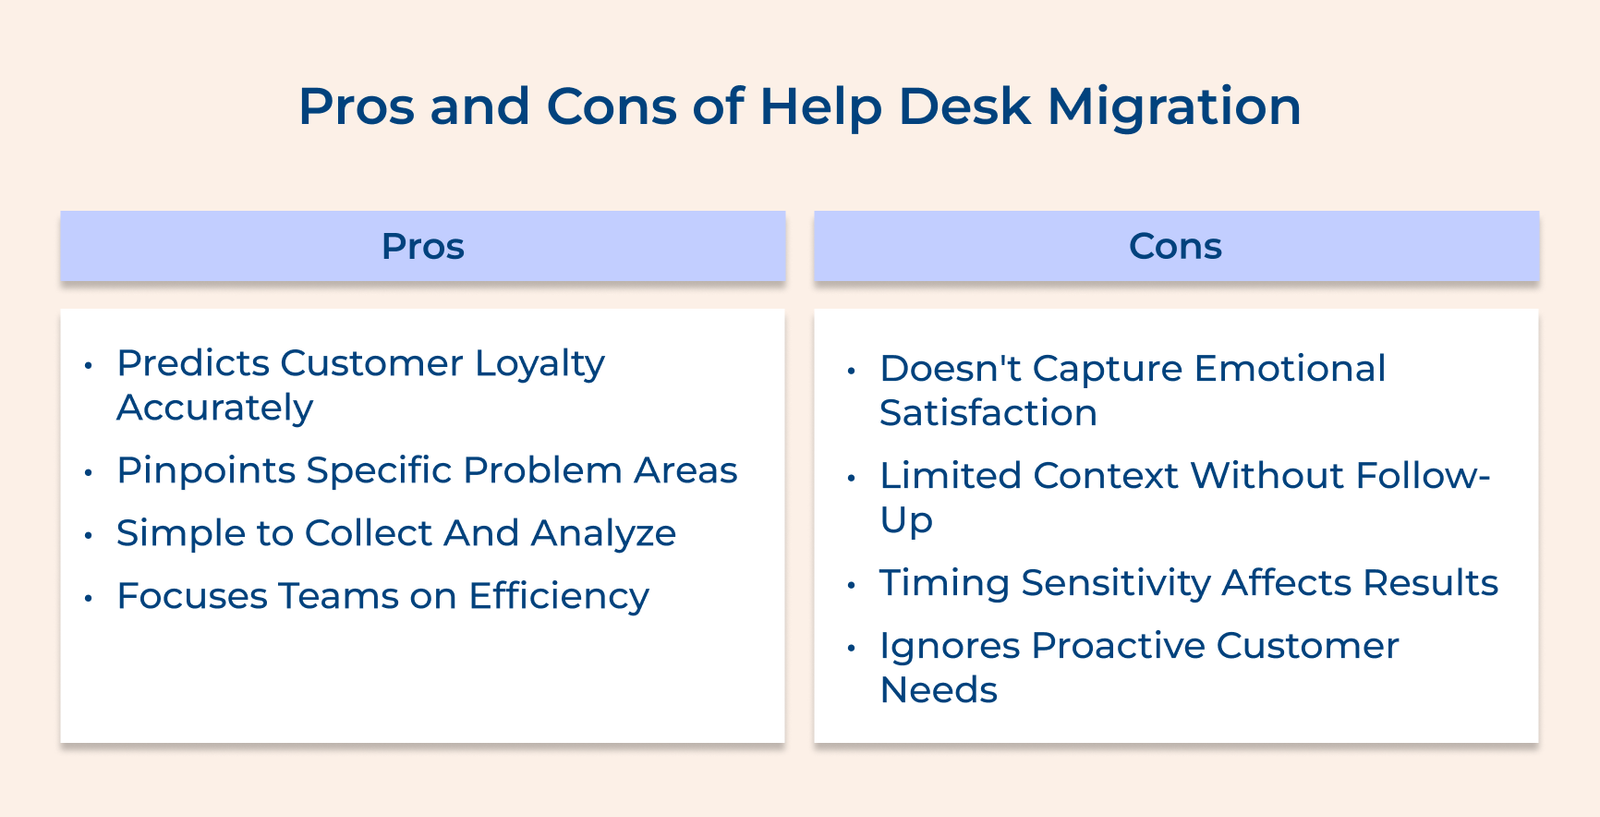
Below are the simple steps to calculate the customer effort score and understand how customer responses translate into a clear number you can track over time.
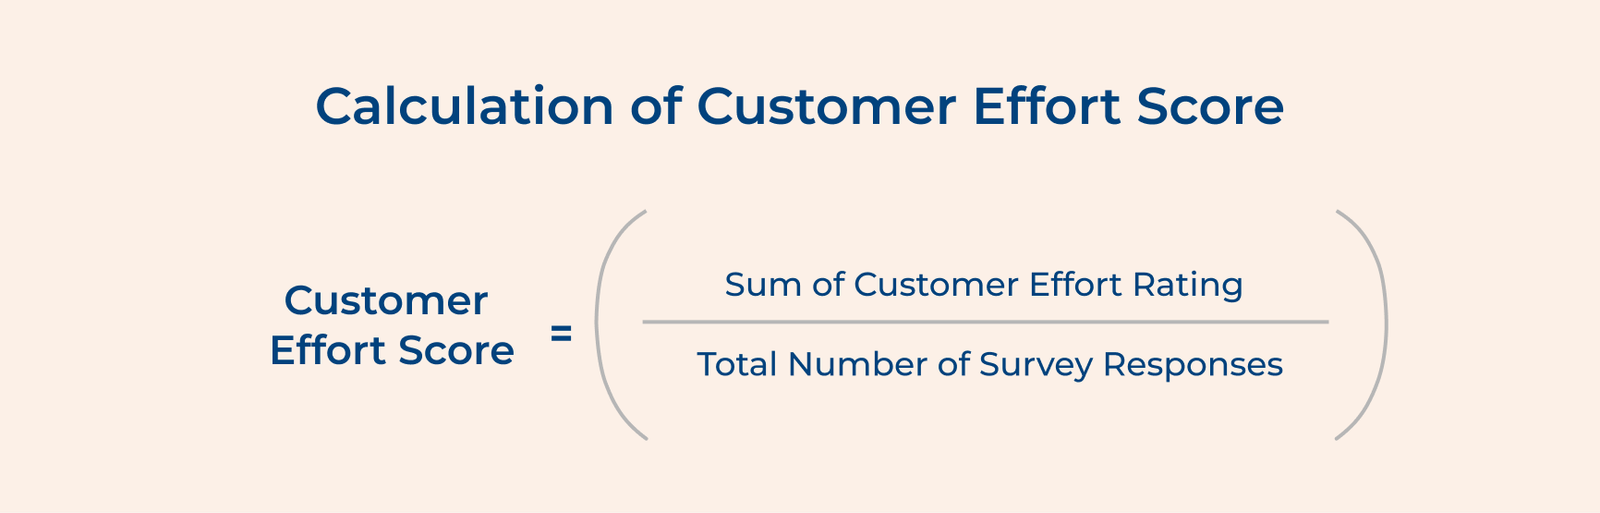
CES = (Number of customers who found it easy / Total number of respondents) × 100
Here’s what each part of the calculation represents in practical terms:
A good CES typically falls above 70%, which means most customers found their interaction easy. Scores above 80% indicate excellent performance, while anything below 60% suggests significant friction that needs addressing. Context matters, though, since different industries have varying benchmarks.
Calculation Example
Let’s assume that you surveyed customers after support interactions using a 7-point scale. Ratings of 1 to 2 indicate high effort, 3 to 5 represent neutral experiences and 6 to 7 indicate low effort.
Survey results:
Calculation:
CES = (375 / 500) × 100 = 75%
A 75 percent score shows that most customers found the interaction simple. One quarter of respondents still faced some level of difficulty. The gap highlights clear opportunities to simplify processes and reduce repeat friction.
Check out the practical steps to measure customer effort score accurately and identify where customers face friction so you can simplify interactions.
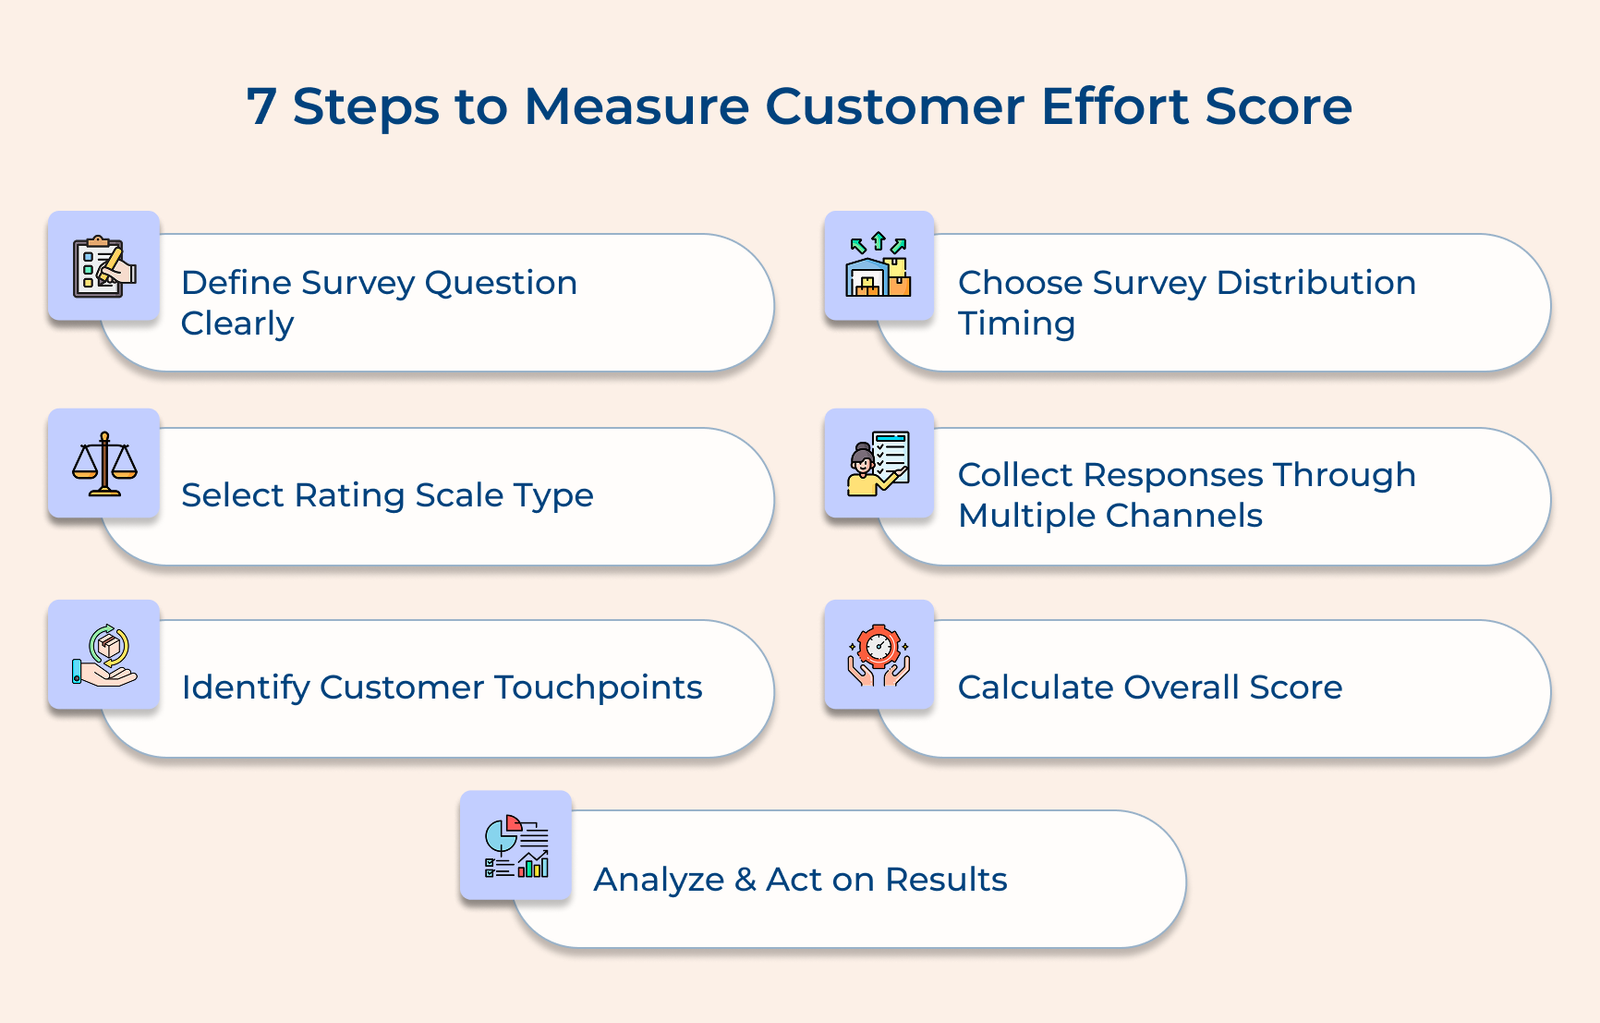
Your survey question sets the foundation for accurate CES measurement. A poorly worded question confuses respondents and gives you unreliable data that won’t help improve customer experience or guide decisions.
Pro tips:
Let’s assume that a software company asks, “How easy was it to install our application?” using a 1-7 scale. It directly measures installation effort without mixing in customer satisfaction or feature quality questions that would muddy the results.
Getting your question right means getting data you can actually use. A clear question leads to honest responses that point you toward real improvements in your customer experience.
Your rating scale shapes how customers express their effort levels. The format affects response rates and the granularity of feedback you receive for identifying problem areas as well as tracking improvements.
As key considerations, you need a scale that’s intuitive enough for quick responses but detailed enough to show meaningful differences. The scale should also align naturally with your question wording to avoid confusion or response hesitation.
Key types:
Remember that more options do not always improve data quality. If you take scales beyond 7 points, it can confuse the respondents. Most customers struggle to distinguish between many similar levels of effort, which weakens the accuracy of your results.
Customer effort score only works when measured at the right moments. Random surveys miss the interactions that truly shape the customer experience. Clear mapping of touchpoints helps you capture effort where it actually matters.
Review the full customer journey from first visit to post-purchase support. List every point where customers take action or need help so you can strategically place surveys at moments that reveal the most about your performance.
Actionable tips:
Survey timing determines if you capture accurate effort perception or faded memories. Sending surveys too late means customers forget details, while sending them too early might catch them before they’ve completed the full experience.
Send Immediately After the Interaction Completes
Send the survey as soon as the interaction finishes. Customers remember the exact steps they took and the obstacles they faced. Fresh experiences lead to clearer and more reliable responses
Avoid Delays that Reduce Response Accuracy
Waiting even a few hours causes customers to forget specific pain points they encountered. Their overall impression might remain, but the details that help you fix problems fade quickly from memory.
Set up automated trigger-based delivery
Use your CRM or support system to automatically send surveys when specific events occur. It ensures consistent timing across all customers and removes the manual work of tracking who needs a survey when.
Customers respond in different ways. Some prefer email. Others answer quickly inside an app or through text. Relying on a single channel limits participation and skews results toward one type of customer.
Key channels:
The step turns raw survey responses into a single actionable metric. Without proper calculation, you can’t track progress over time or compare performance across different teams and touchpoints in your organization.
Add the number of responses in the easy category. Divide that figure by the total number of responses. Multiply the result by 100 to express it as a percentage. It shows how many customers experienced low effort.
Best practices:
The step turns your CES data into concrete improvements that reduce customer friction. Skipping analysis means you’ve collected data but haven’t learned anything useful or made changes that actually help customers and improve their experience.
Pro tips:
The following are four scenarios where the customer effort score (CES) delivers the most valuable insights for your business.
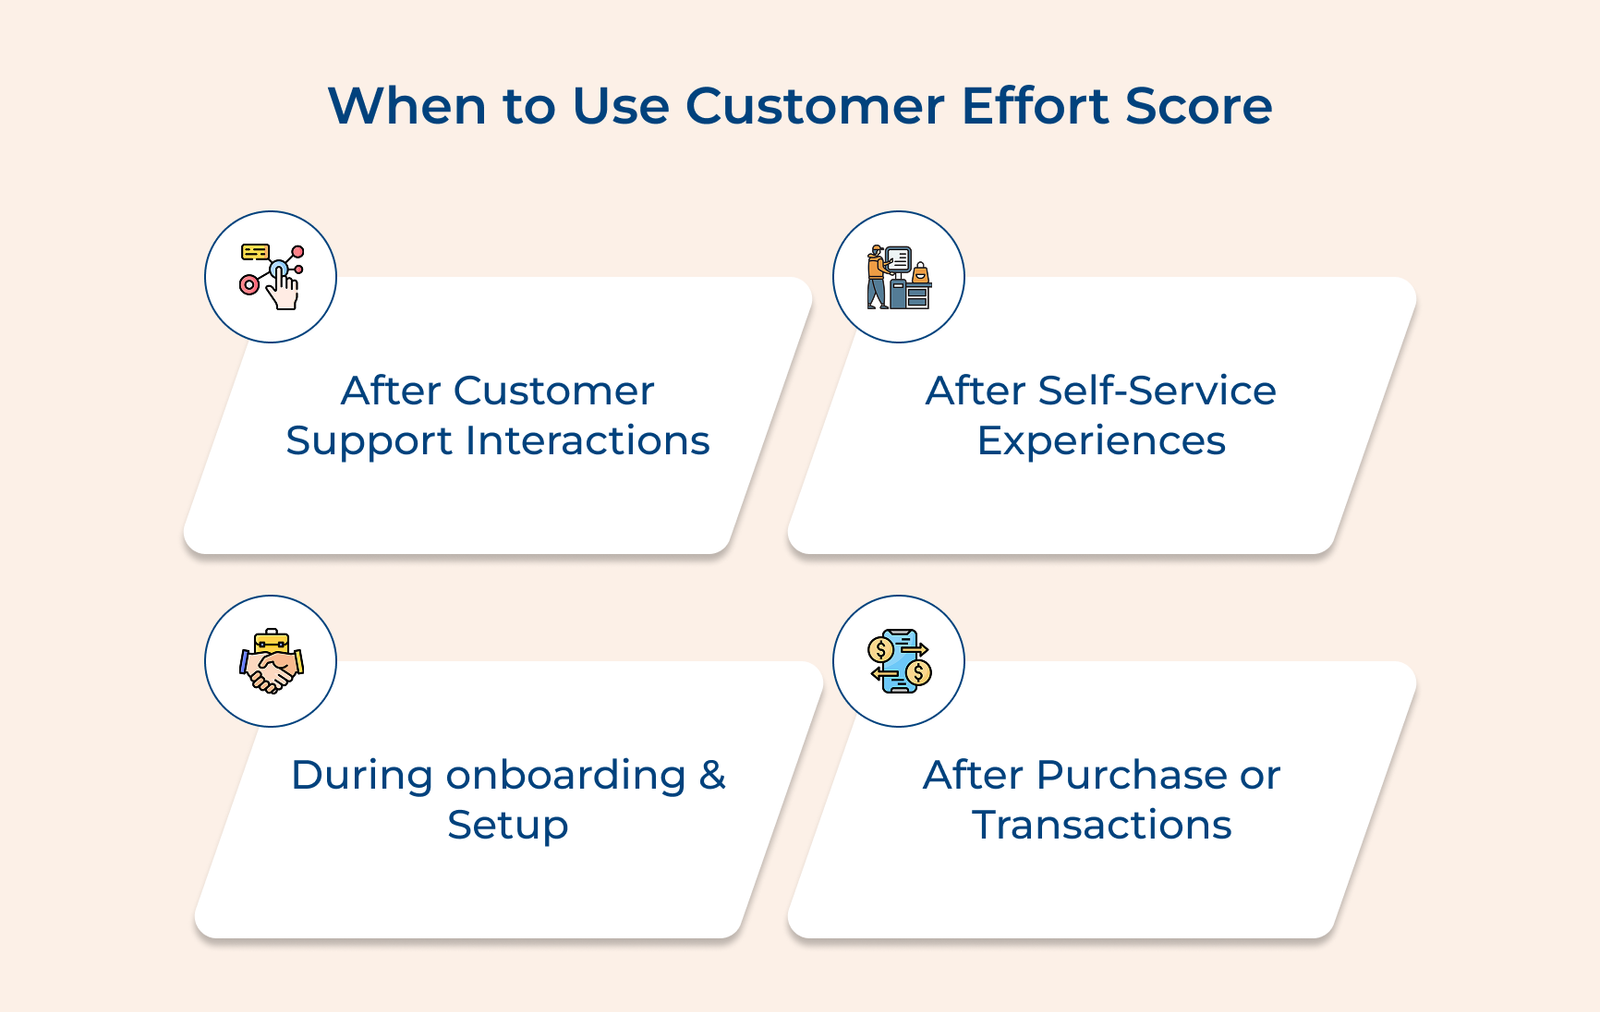
After Customer Support Interactions
Send CES surveys right after a support ticket closes or a live chat ends. Immediate feedback shows how much effort the customer invested to get a resolution. Low scores often highlight repeated explanations, long wait times or unclear guidance.
Following Self-service Experiences
Measure effort after customers use your knowledge base, FAQ section or automated troubleshooting tools. High effort here suggests content is hard to navigate or answers are unclear. Strong self-service should reduce contact, not push customers back to support
During Onboarding and Product Setup
Ask for effort feedback once new customers finish account setup or initial configuration. Early friction can create doubt and drop-offs before customers see real value. Clear insight at this stage helps you simplify first impressions.
Post-purchase or Transaction Completion
Collect scores after checkout, returns, upgrades or cancellations. Transactional moments shape trust. Smooth experiences increase the likelihood of repeat business, while friction in these steps discourages future engagement.
Check out a few effective CES questions organized by type to help you choose the best approach for your situation.
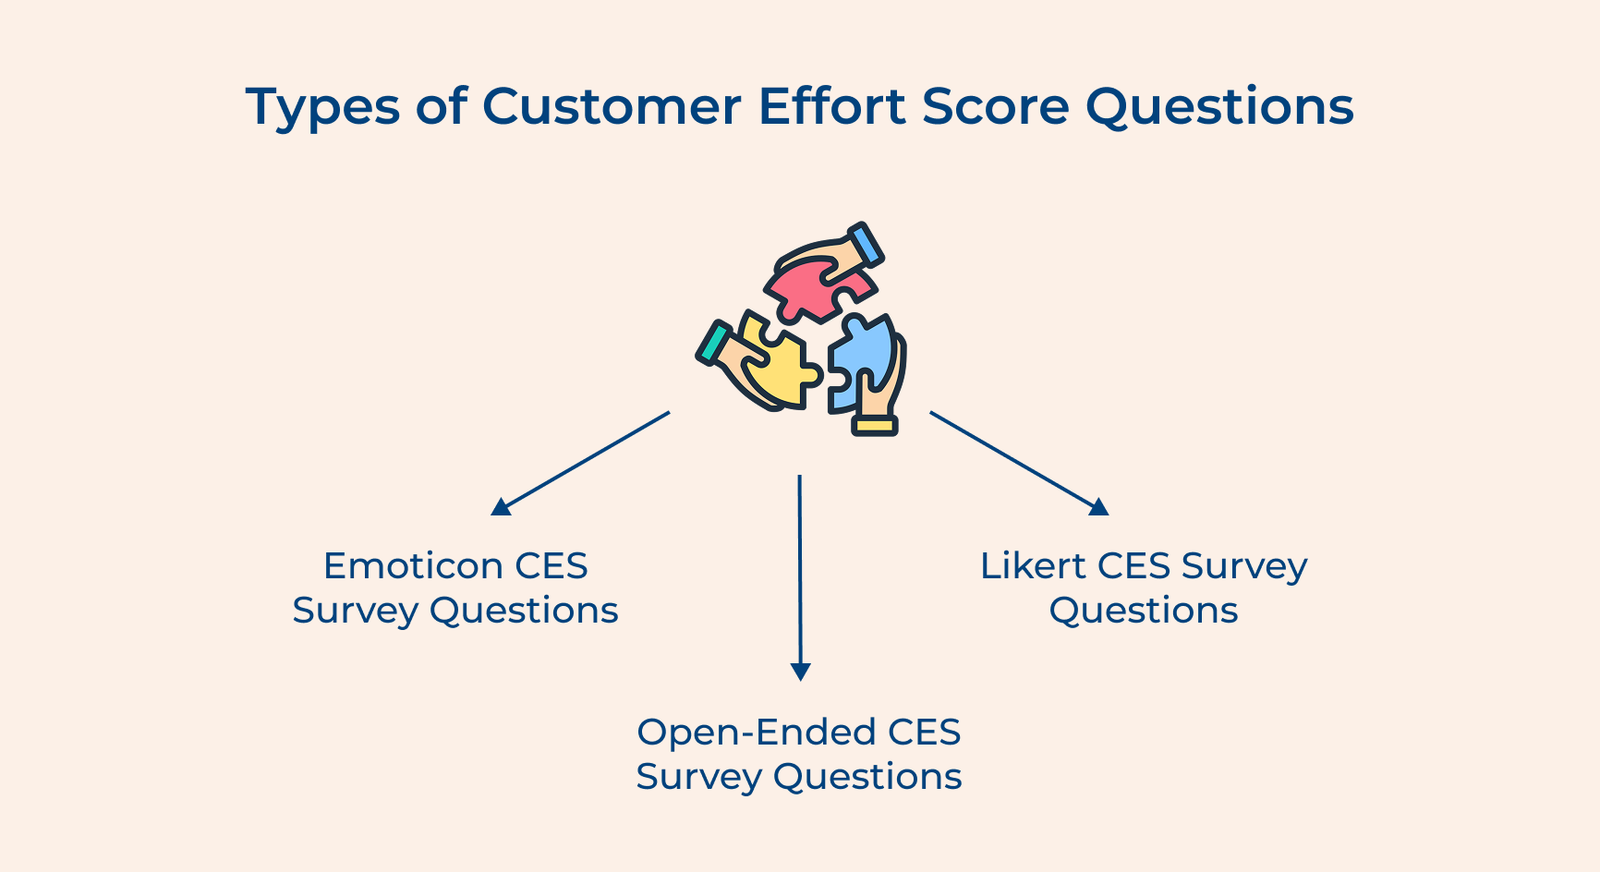
Visual CES questions use emoji scales or faces to make responses quick and intuitive. Customers can tap a face that matches their experience without reading long descriptions. The format works well on mobile devices and across different languages.
Key questions:
Open-ended questions give customers space to describe their experience in detail. Numeric ratings show how much effort they felt. Written responses explain why. The questions work best as follow-ups to low or neutral scores.
Core questions:
Agreement-based CES questions measure how strongly customers feel about the effort involved. They work well for measuring overall effort perception and comparing responses across different customer segments or time periods.
Essential questions:
Let’s go through the best practices that will help you systematically lower friction and create experiences that feel effortless for your customers.
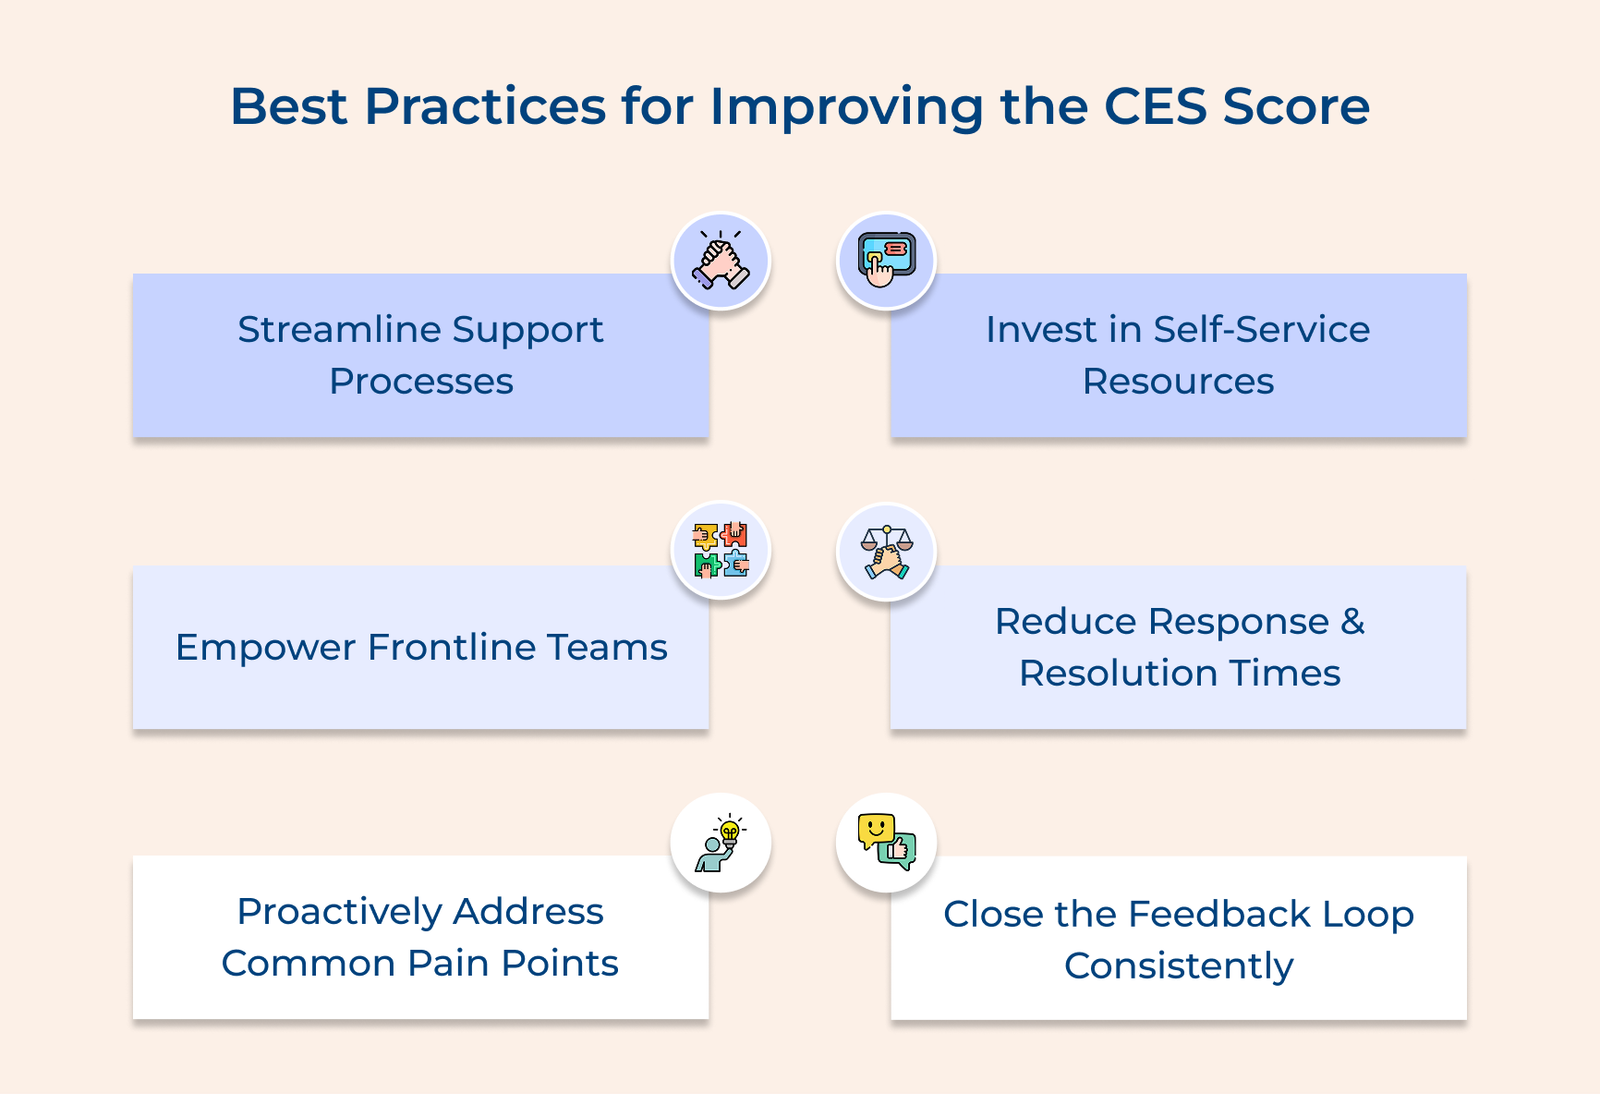
1. Streamline Your Support Processes
Map out every step customers take when they need help from you. Eliminate redundant questions, unnecessary transfers and repeated authentication requests that force people to explain their problem multiple times to different support team members.
Key ways:
Every extra step you add multiplies customer frustration exponentially. When someone has already spent 10 minutes troubleshooting on their own, making them wait through three more steps kills their patience entirely.
2. Invest in Self-service Resources
Build detailed knowledge bases and FAQs that actually answer common questions customers ask. Your help content should be searchable, updated regularly and written in plain language that doesn’t require technical expertise to understand.
Self-service isn’t just about having articles available somewhere on your website. It’s about making answers so easy to find that customers solve problems faster alone than they would by contacting support.
3. Empower Your Frontline Teams
Give support agents the authority and tools to resolve issues without seeking manager approval. When agents can make decisions and take action immediately, customers don’t waste time waiting for callbacks or escalations that stretch resolution across days.
Key strategies:
Training matters as much as authority does here. Agents who deeply understand your products can solve problems faster and suggest proactive solutions that prevent customers from contacting you again.
4. Reduce Response and Resolution Times
Speed directly impacts effort because waiting feels like work to customers. Set clear targets for first response times and measure how quickly issues reach complete resolution rather than just initial acknowledgment.
Monitor average handling time carefully. Speed should not come at the cost of accuracy. Quick but incomplete answers often lead to repeat contact, which increases overall effort. Efficient and thorough resolutions create smoother experiences.
5. Proactively Address Common Pain Points
Analyze your customer effort score data to identify recurring low scores at specific touchpoints. Fix the root causes of the friction points instead of just training agents to apologize better when customers complain about them.
Key takeaways:
Improvements may require time and resources. Ignoring friction often costs more through churn and repeated support contact. Start with high-impact areas where small process changes reduce effort across many customer interactions.
6. Close the Feedback Loop Consistently
Share customer effort score results with your entire team and celebrate improvements together. When employees see how their work reduces customer effort, they stay motivated to find new ways to simplify experiences.
Create quarterly action plans based on survey feedback and assign clear owners to each improvement initiative. Track progress publicly so everyone knows if the changes actually moved your scores or just sounded good in planning meetings.
Customer effort highlights a simple truth. Customers stay when interactions feel easy. Lower effort means higher loyalty and more customers who stick around for the long term. Small frustrations repeated over time quietly erode loyalty
Start measuring effort at your most critical touchpoints today. Use the insights to eliminate friction systematically and watch your customer relationships strengthen as interactions become genuinely effortless.

A strong CES usually sits above 70%, which shows most customers found the interaction easy. Scores above 80 percent reflect smooth processes. Results below 60 percent point to noticeable friction that needs attention.
Customer efficiency score is simply another term some companies use for customer effort score. Both measure the idea of how easy or difficult it is for customers to complete an interaction with your business.
CES and CSAT measure different aspects of the experience. CSAT captures overall satisfaction. CES focuses only on ease of interaction. Many teams track both to understand satisfaction and effort separately.
NPS measures the likelihood to recommend your company, while CES measures interaction ease. NPS predicts word-of-mouth growth while CES identifies operational friction points. Both are valuable but CES gives more actionable insights for process improvements.
Send surveys right after key interactions such as support conversations, purchases or onboarding steps. Immediate timing captures accurate effort perception. Automated triggers help maintain consistent delivery across touchpoints.
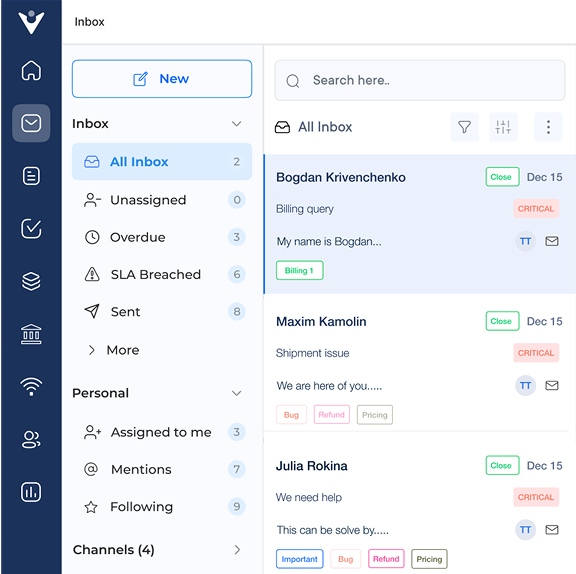
Grow Customer Relationships and stronger team collaboration with our range of products across the Conversational Engagement Suite.
Omnichannel Customer Support & Help Desk Software
AI Enabled Business Messaging and Chatbot Software
Sales Engagement & CRM Software
Call Center Software & Virtual Phone System
Product Marketing & Experience Platform
Customer Experience & Feedback Management Software

 Help Desk Migration Guide: Key Steps, Challenges & Best Practices
Scroll to top
Help Desk Migration Guide: Key Steps, Challenges & Best Practices
Scroll to top