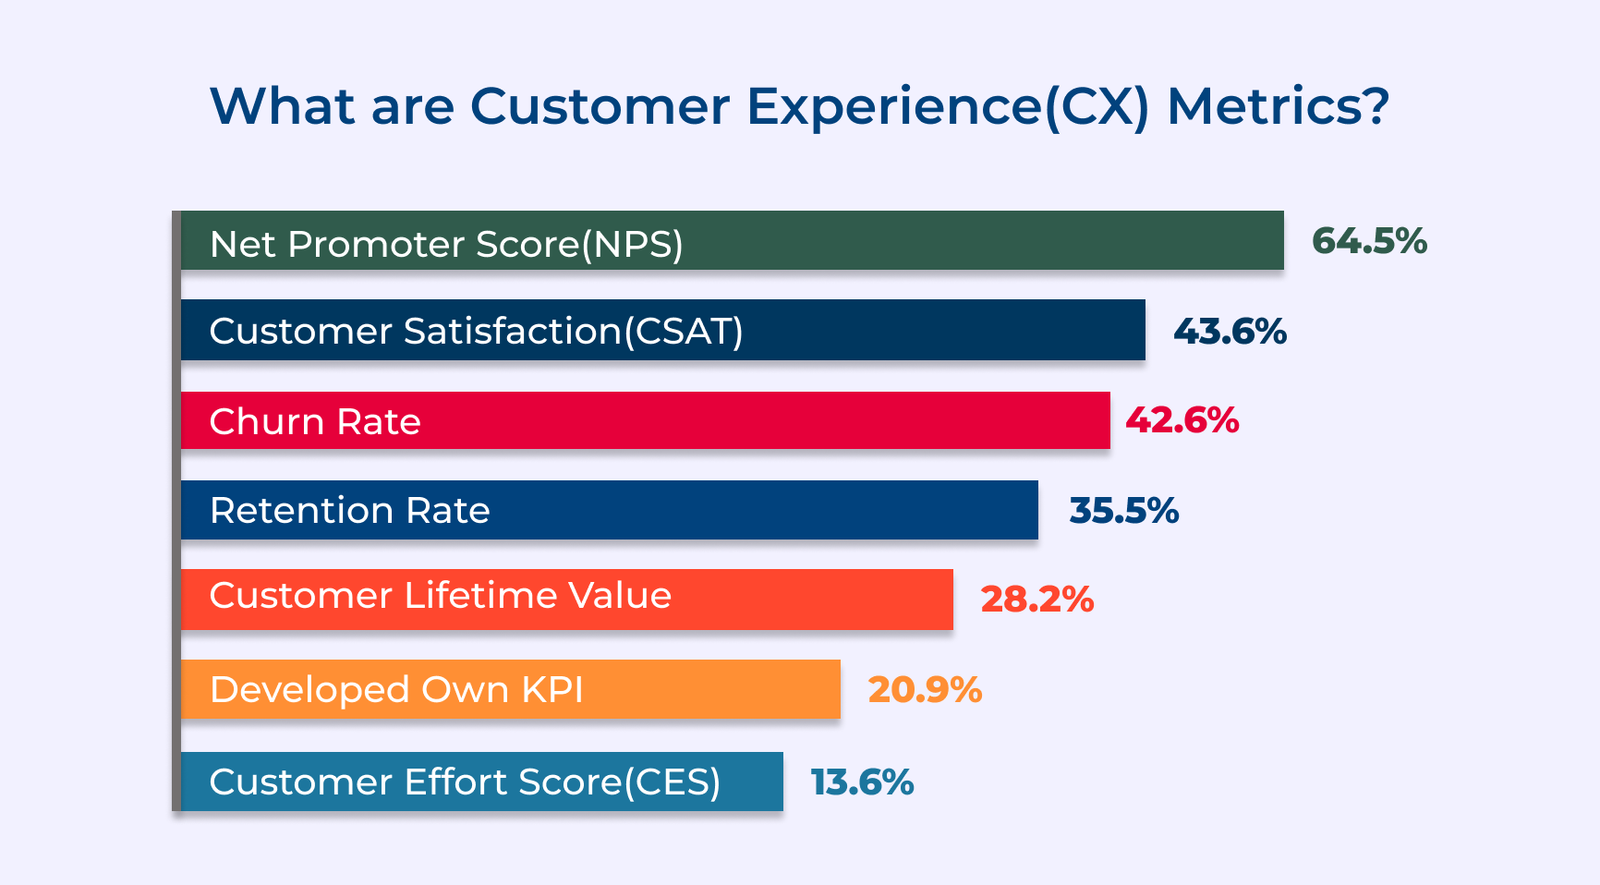
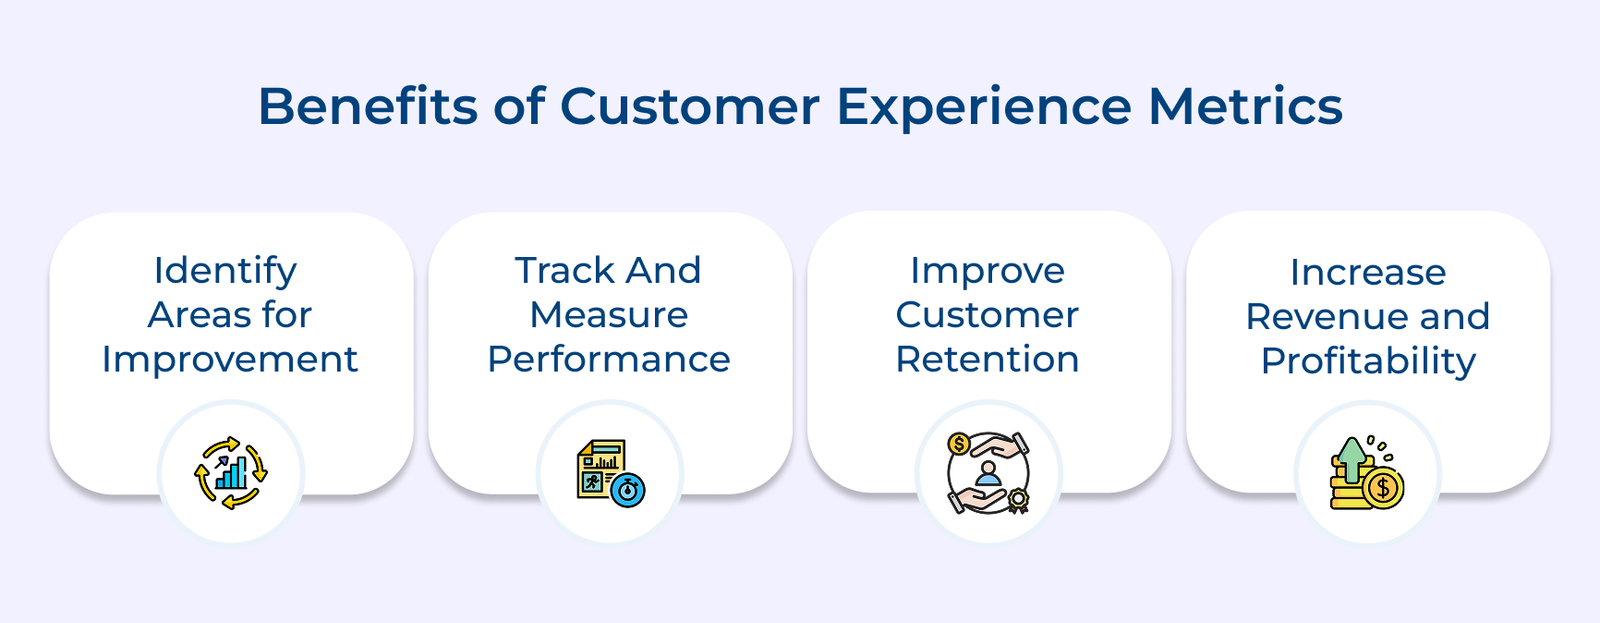
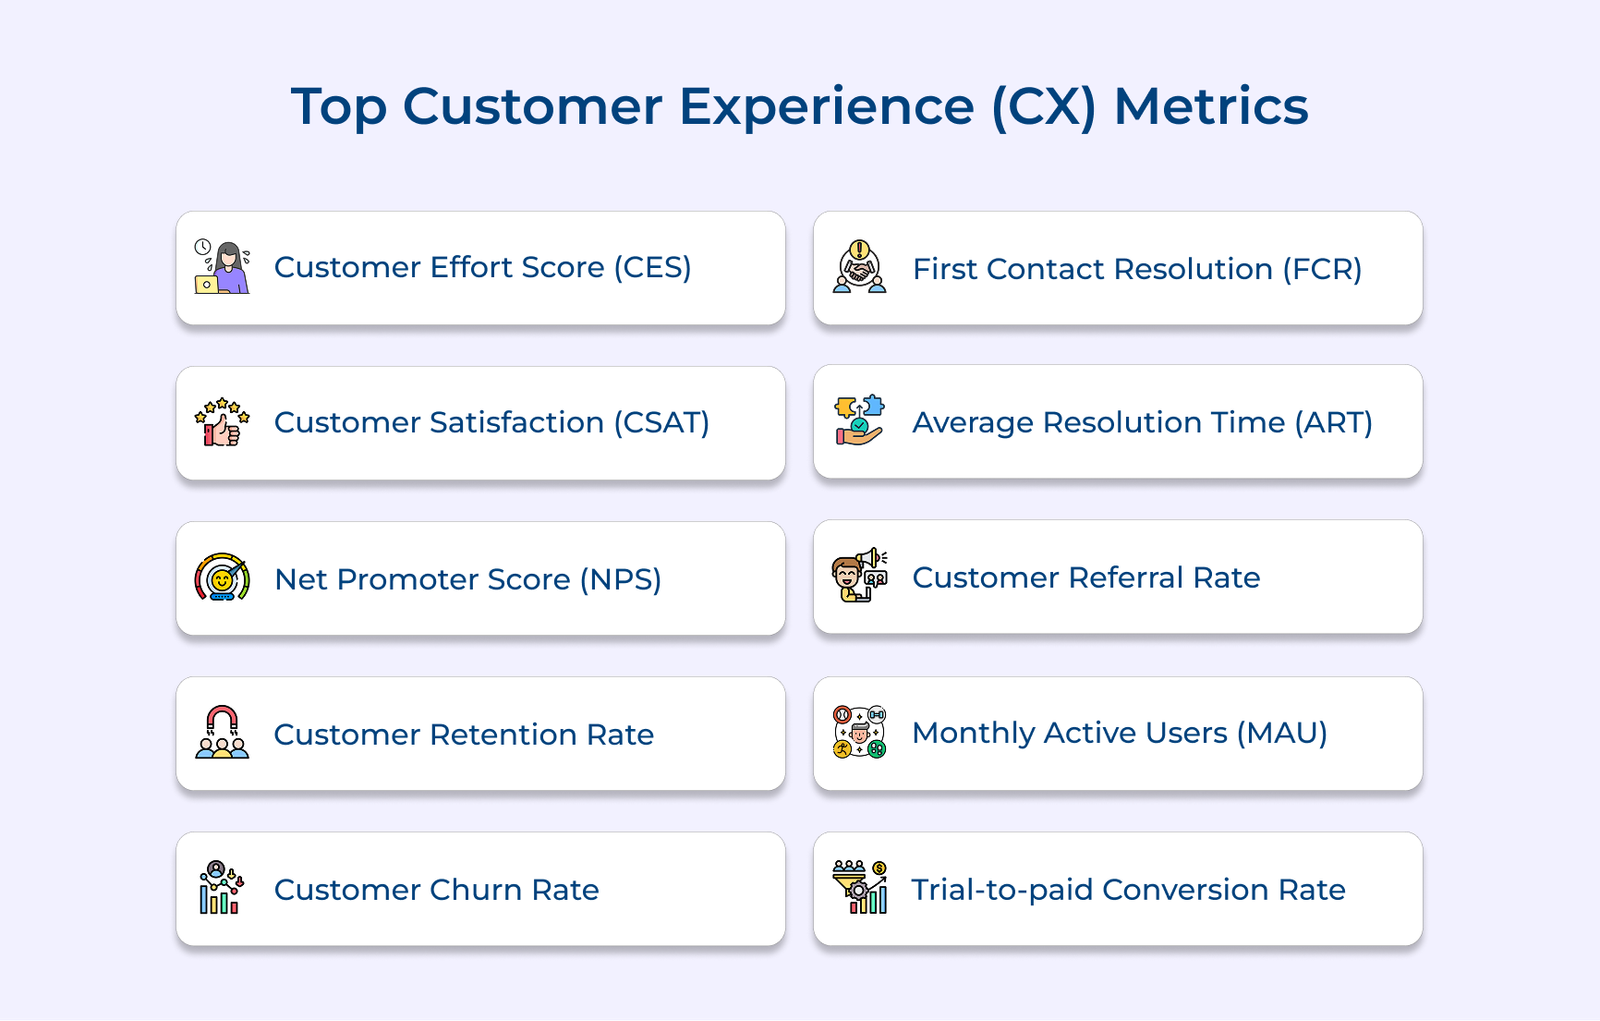
1. Customer Effort Score (CES)
The purpose is to evaluate the customer experience and identify areas for improvement. The formula for CES is CES = Sum of Effort Ratings / Total Number of Respondents. Calculation involves surveying customers after an interaction and asking them to rate the effort required on a scale (e.g., 1-7). The sum of ratings is divided by the total number of respondents.
Benefits of CES include its simplicity, focus on customer effort (a key driver of loyalty) and ability to pinpoint pain points. Drawbacks are its subjectivity, potential bias from small sample sizes and limited insights into root causes.
How to improve:
- Identify and resolve high-effort touchpoints.
- Train customer service teams on efficient issue resolution.
- Streamline processes and self-service options to reduce customer effort.
2. Customer Satisfaction (CSAT)
Customer Satisfaction (CSAT) is a widely used metric that measures how satisfied customers are with a particular product, service, or interaction. The primary purpose of CSAT is to gauge the customer experience and identify areas for improvement.
The formula for calculating CSAT is (Number of Satisfied Customers / Total Number of Respondents) x 100%. CSAT is typically calculated by sending a survey to customers after an interaction or purchase, asking them to rate their satisfaction level on a scale, such as 1-5 or 1-10. Responses above a certain threshold (e.g., 4 or 5) are considered “satisfied.”
Best practices:
- Analyze CSAT data to identify pain points and areas for improvement.
- Implement customer feedback loops and act on customer suggestions.
- Train employees on customer service best practices based on CSAT insights.
3. Net Promoter Score (NPS)
Net Promoter Score (NPS) is a widely used metric that measures customer loyalty and the likelihood of customers recommending a company’s offerings to others. Its purpose is to gauge customer satisfaction and identify potential brand advocates or detractors.
The formula for calculating NPS is (% of Promoters – % of Detractors) x 100. NPS is typically calculated by asking customers a single question: “On a scale of 0-10, how likely are you to recommend our company/product/service to a friend or colleague?”
Respondents who give a score of 9 or 10 are considered “Promoters,” those who give a score of 0-6 are “Detractors,” and those who give a 7 or 8 are “Passives” (and are not included in the calculation).
Drawbacks of NPS:
- Relies on a single question, which may not capture the full customer experience.
- Interpretation of scores can vary across industries and cultures.
- Does not provide actionable insights for improving customer experience.
4. Customer Retention Rate
Customer Retention Rate is a powerful metric that measures a company’s ability to retain its existing customers over a given period. The primary purpose of the metric is to evaluate customer loyalty and the customer experience.
The formula for calculating the Customer Retention Rate is: (Number of Customers at End of Period – Number of New Customers Acquired During Period) / Number of Customers at Start of Period x 100%.
Businesses typically track the number of customers they had at the beginning of a specific period (e.g., a month or a year), subtract the number of new customers acquired during that period and divide the result by the starting number of customers.
Key benefits:
- A direct measure of customer loyalty and satisfaction, as satisfied customers are more likely to remain with a company.
- Highlights the effectiveness of a company’s customer experience strategies and efforts to retain existing customers.
- Improving customer retention can lead to significant cost savings, as acquiring new customers is often more expensive than retaining existing ones.
5. Customer Churn Rate
Customer churn rate measures the percentage of customers who have stopped using a company’s products or services within a given period. Its primary purpose is to evaluate customer satisfaction, loyalty and the customer experience.
Businesses can divide the number of customers lost during a specific period by the total number of customers at the beginning of that period and then multiply by 100 to calculate the customer churn rate.
Customer churn rate is an important metric because it directly reflects customer satisfaction and loyalty. A high churn rate can indicate issues with the product, service, or customer experience, leading to customer attrition.
Pro tips:
- Analyze churn data to identify patterns and root causes of customer dissatisfaction, such as poor product quality, inadequate customer support, or pricing issues.
- Implement customer feedback mechanisms to gather insights from churned customers and address their concerns.
- Develop targeted retention strategies to reduce churn and improve customer loyalty.
6. First Contact Resolution (FCR)
First Contact Resolution (FCR) is a metric that measures the percentage of customer inquiries or issues resolved during the initial interaction with the company. The formula for calculating FCR is (Number of Inquiries Resolved on First Contact / Total Number of Inquiries) x 100%.
Businesses typically track the number of customer inquiries or issues that are resolved during the first interaction, such as a phone call, email, or chat session. They then divide the number by the total number of inquiries received during the same period.
How to implement:
- Analyze FCR data to identify common issues and areas for agent training or process improvements.
- Implement knowledge management systems and self-service options to empower customers with relevant information.
- Continuously gather customer feedback and incorporate it into FCR optimization efforts.
7. Average Resolution Time (ART)
Average Resolution Time (ART) is a metric that measures the average time it takes for a company to resolve a customer’s inquiry or issue. Its primary purpose is to evaluate the efficiency of customer service operations and the customer experience. The formula for calculating ART is: Total Time Spent Resolving Inquiries / Total Number of Inquiries
Businesses typically track the time spent resolving each customer inquiry, from the initial contact until a satisfactory resolution is achieved. The total time is then divided by the total number of inquiries received during the same period.
Three ways to use ART to improve the customer experience:
- Analyze ART data to identify recurring issues or channels with longer resolution times, and implement process improvements or additional resources.
- Provide agents with proper training, knowledge resources and tools to enable more efficient resolution of inquiries.
- Set ART targets or benchmarks and incentivize agents or teams to continuously improve their performance.
8. Customer Referral Rate
Customer Referral Rate is a metric that measures the percentage of a company’s customers who actively recommend its products or services to others. It provides valuable insights into customer satisfaction, loyalty and the customer experience.
The formula for calculating the Customer Referral Rate is: Customer Referral Rate = (Number of Referred Customers / Total Number of Customers) x 100%
Businesses typically track the number of new customers acquired through referrals from existing customers over a specific period. The number is then divided by the total number of customers during the same period and multiplied by 100. Let’s assume that a company had 10,000 customers and gained 500 new customers through referrals in a month, the Customer Referral Rate would be:
(500 / 10,000) x 100% = 5%
Key benefits:
- Businesses get a direct measure of customer satisfaction and loyalty, as satisfied customers are more likely to refer others.
- Referrals from existing customers can be a cost-effective way to acquire new customers.
- A high Customer Referral Rate can be an indicator of a strong brand reputation and positive customer experience.
9. Monthly Active Users (MAU)
Monthly Active Users (MAU) is a metric that measures the number of unique users who actively engage with a product or service within a given month. Its primary purpose is to evaluate the customer experience, product adoption and customer retention.
The formula for calculating MAU is straightforward:
MAU = Number of Unique Users Active in a Given Month
Businesses typically track and count the unique users who perform specific actions or interactions with their product or service during a calendar month. The actions can vary depending on the industry or product, such as logging into an app, making a purchase, or engaging with content.
Pro tips:
- Segment MAU data: Analyze MAU by different user segments such as demographics, acquisition channels, or engagement levels, to identify areas for improvement.
- Track MAU trends: Monitor MAU over time to identify patterns, seasonality, or changes in user behavior that may indicate shifts in the customer experience.
- Combine with other metrics: Use MAU in conjunction with metrics like retention rate, churn rate, or engagement to gain a detailed understanding of the customer journey.
10. Trial-to-paid Conversion Rate
Trial-to-paid conversion rate is a crucial metric for measuring customer experience as it indicates how effective the product or service is at converting trial users into paying customers. The purpose of the metric is to evaluate the success of the marketing and sales strategies in persuading users to purchase after trying out the offering.
The formula for calculating the trial-to-paid conversion rate is simple: A total number of paid conversions divided by the total number of trial users, multiplied by 100 to get a percentage. Let’s assume that you had 100 trial users and 10 of them converted to paid customers, the conversion rate would be 10%.
Best practices:
- Understanding the trial users’ needs and pain points to tailor the messaging accordingly.
- Implementing a seamless trial experience with clear call-to-actions and easy payment options.
- Analyzing conversion data regularly to identify any bottlenecks or areas for improvement in the conversion funnel.
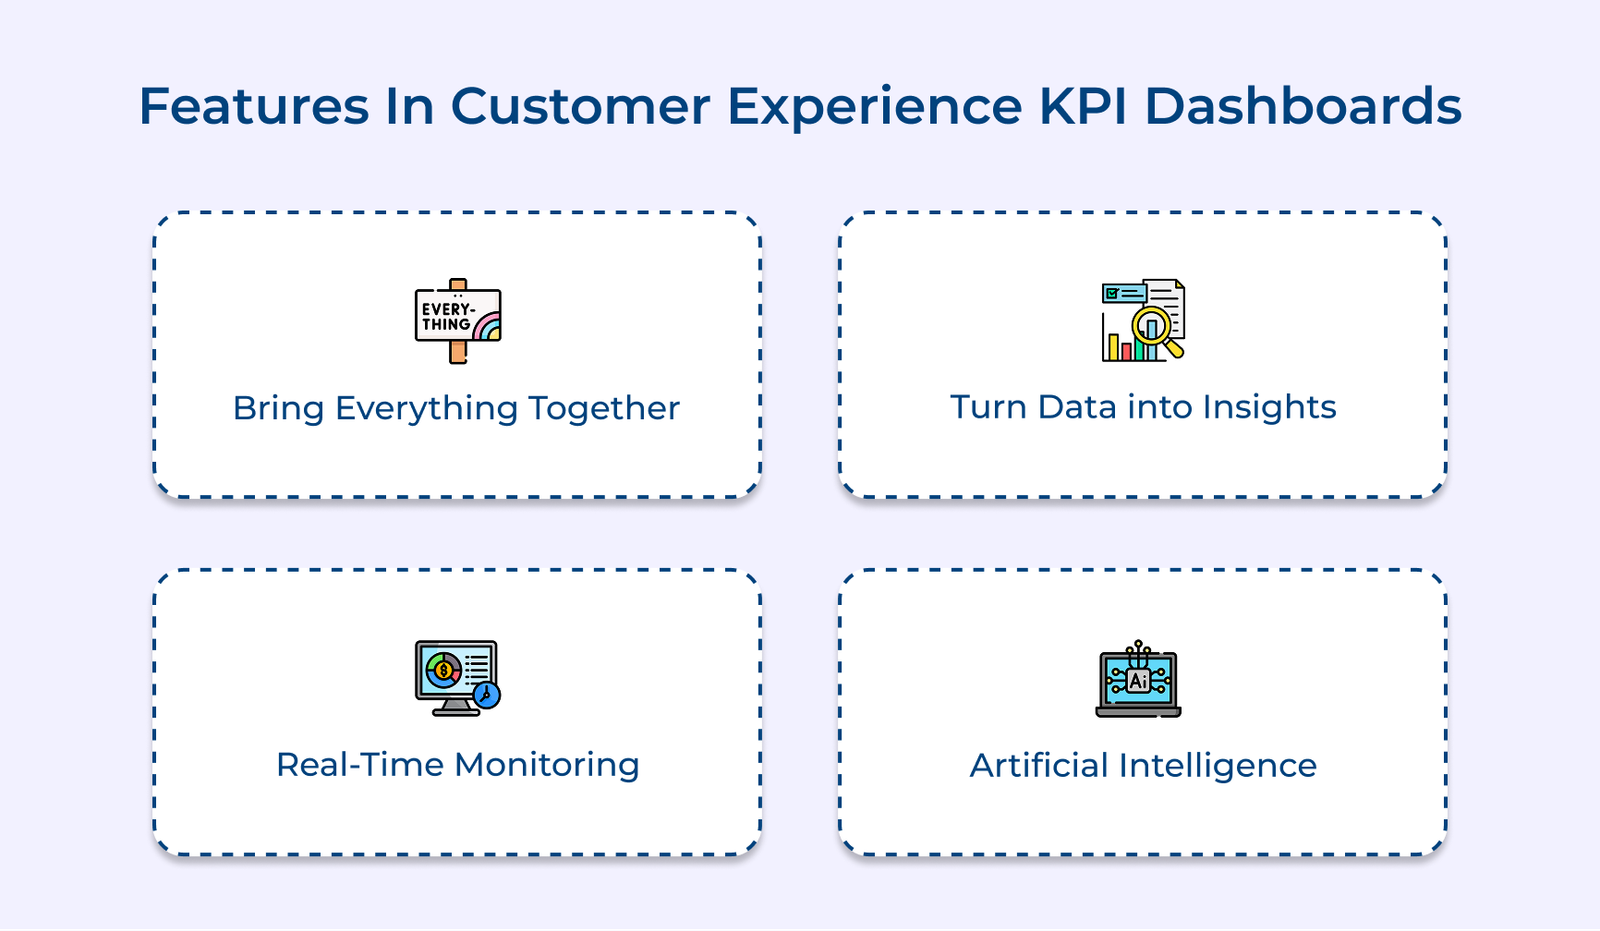
What to Look for in Customer Experience KPI Dashboards?
Discover the essential features and functionalities to consider when selecting a customer experience KPI dashboard.


