Helpdesk Analytics

Get Actionable Insights with Powerful Help Desk Analytics & Dashboards

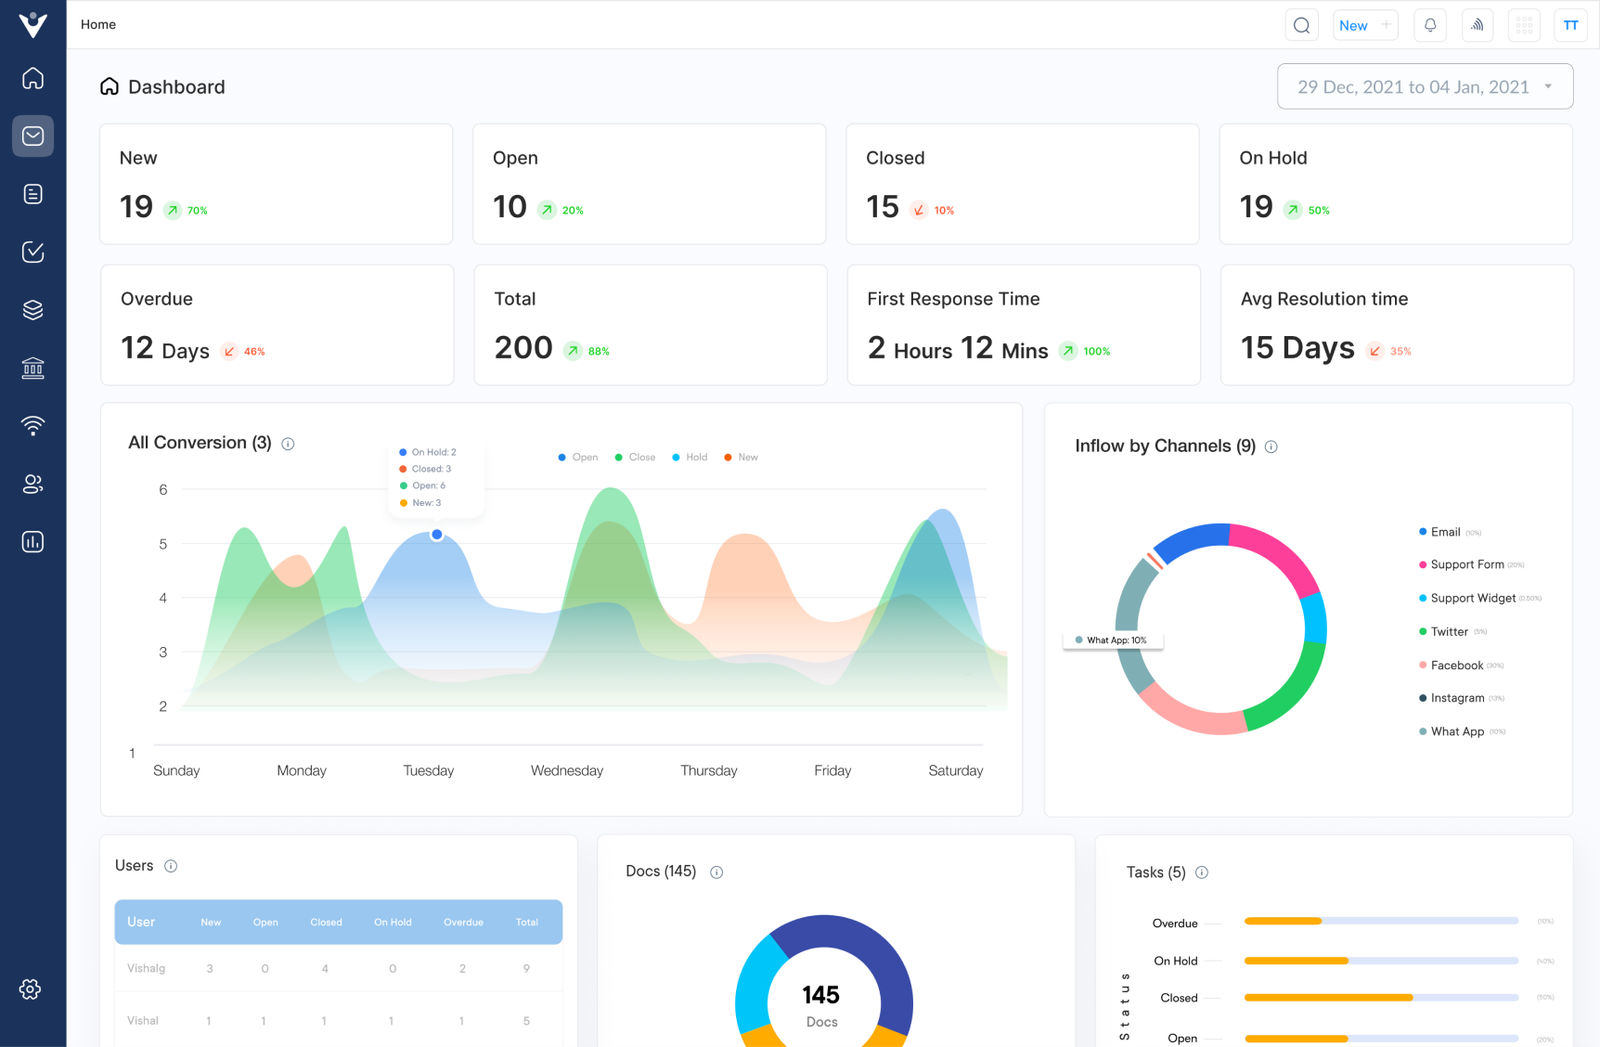
Take customer service performance to next level with Veemo Support’s comprehensive help desk analytics. Create custom reports, track important KPIs and keep a close eye on customer satisfaction with visually stunning charts.

No credit card required. Easy setup

Helpdesk Analytics

Trusted by Leading Brands

Transform Your Decision-Making with Comprehensive Help Desk Analytics

Enable business decisions with advanced help desk dashboards and reporting analytics for improved customer service performance.

Better Help Desk Analytics and Reporting

Transform a business into an insight-driven enterprise with advanced help desk analytics and customer service insights.

Improve Customer Service Performance

Leverage data and analytics to measure and improve customer experience. Efficiently monitor agent productivity, customer experience and ticket metrics. All of it with a single click!

Omnichannel Online Desk Analytics

Understand how customers communicate with a business across all channels to deliver better contextual support. It emphasizes the importance of having a strong online presence.

Conversations

Get a unified view of all conversations to measure customer metrics such as First Response Time (FRT) and resolution time. Businesses can assess their performance in terms of customer service and identify areas for improvement.

Customer Satisfaction

Continuously enhance your customer by actively collecting feedback and calculating the Customer Satisfaction Score (CSAT) after every conversation.

Customer Support Automation

Leverage knowledge base to deliver self-service support, deflect tickets, reduce costs and reduce costs associated with manual response times.

Efficient and effective customer support is crucial. Managing a help desk can be a daunting task, with a constant influx of queries, tickets, and customer interactions. Identifying improvement areas, streamlining processes, and optimising resource allocation become challenging. Failing to leverage service desk analytics can lead to longer resolution times, decreased customer satisfaction and inefficient use of resources.

Help desk analytics provides a powerful solution by transforming raw data into actionable insights. These insights also showcase the help desk RoI, allowing businesses to make data-driven decisions to enhance their support operations. It improves customer experience and drives overall organizational success.

What is Help Desk Analytics?

Help desk analytics refers to the process of collecting, analyzing, and interpreting data from help desk operations to gain insights into performance, efficiency, and customer satisfaction. It helps organizations better understand the complexity of their customers and increase productivity by providing actionable insights into customer support activities.
Help desk dashboards transform raw data into actionable insights. It enables the support teams to operate more efficiently, respond to issues more effectively and provide better service to customers. They serve as a central nervous system for customer support operations, guiding strategy and day-to-day decisions to optimize performance.

Key elements:

  • Data collection: Gathering information from various sources such as ticket management systems, customer interactions, surveys, and support channels.
  • Metrics and KPIs: Tracking important measures like response time, resolution time, customer satisfaction scores, first contact resolution rate, and ticket volume.
  • Reporting: Creating visual representations of data through dashboards and reports for easy interpretation.
  • Trend analysis: Identifying patterns and trends in support issues, customer behavior, and team performance over time.
  • Predictive analytics: Using historical data to forecast future trends, such as expected ticket volumes or potential issues.

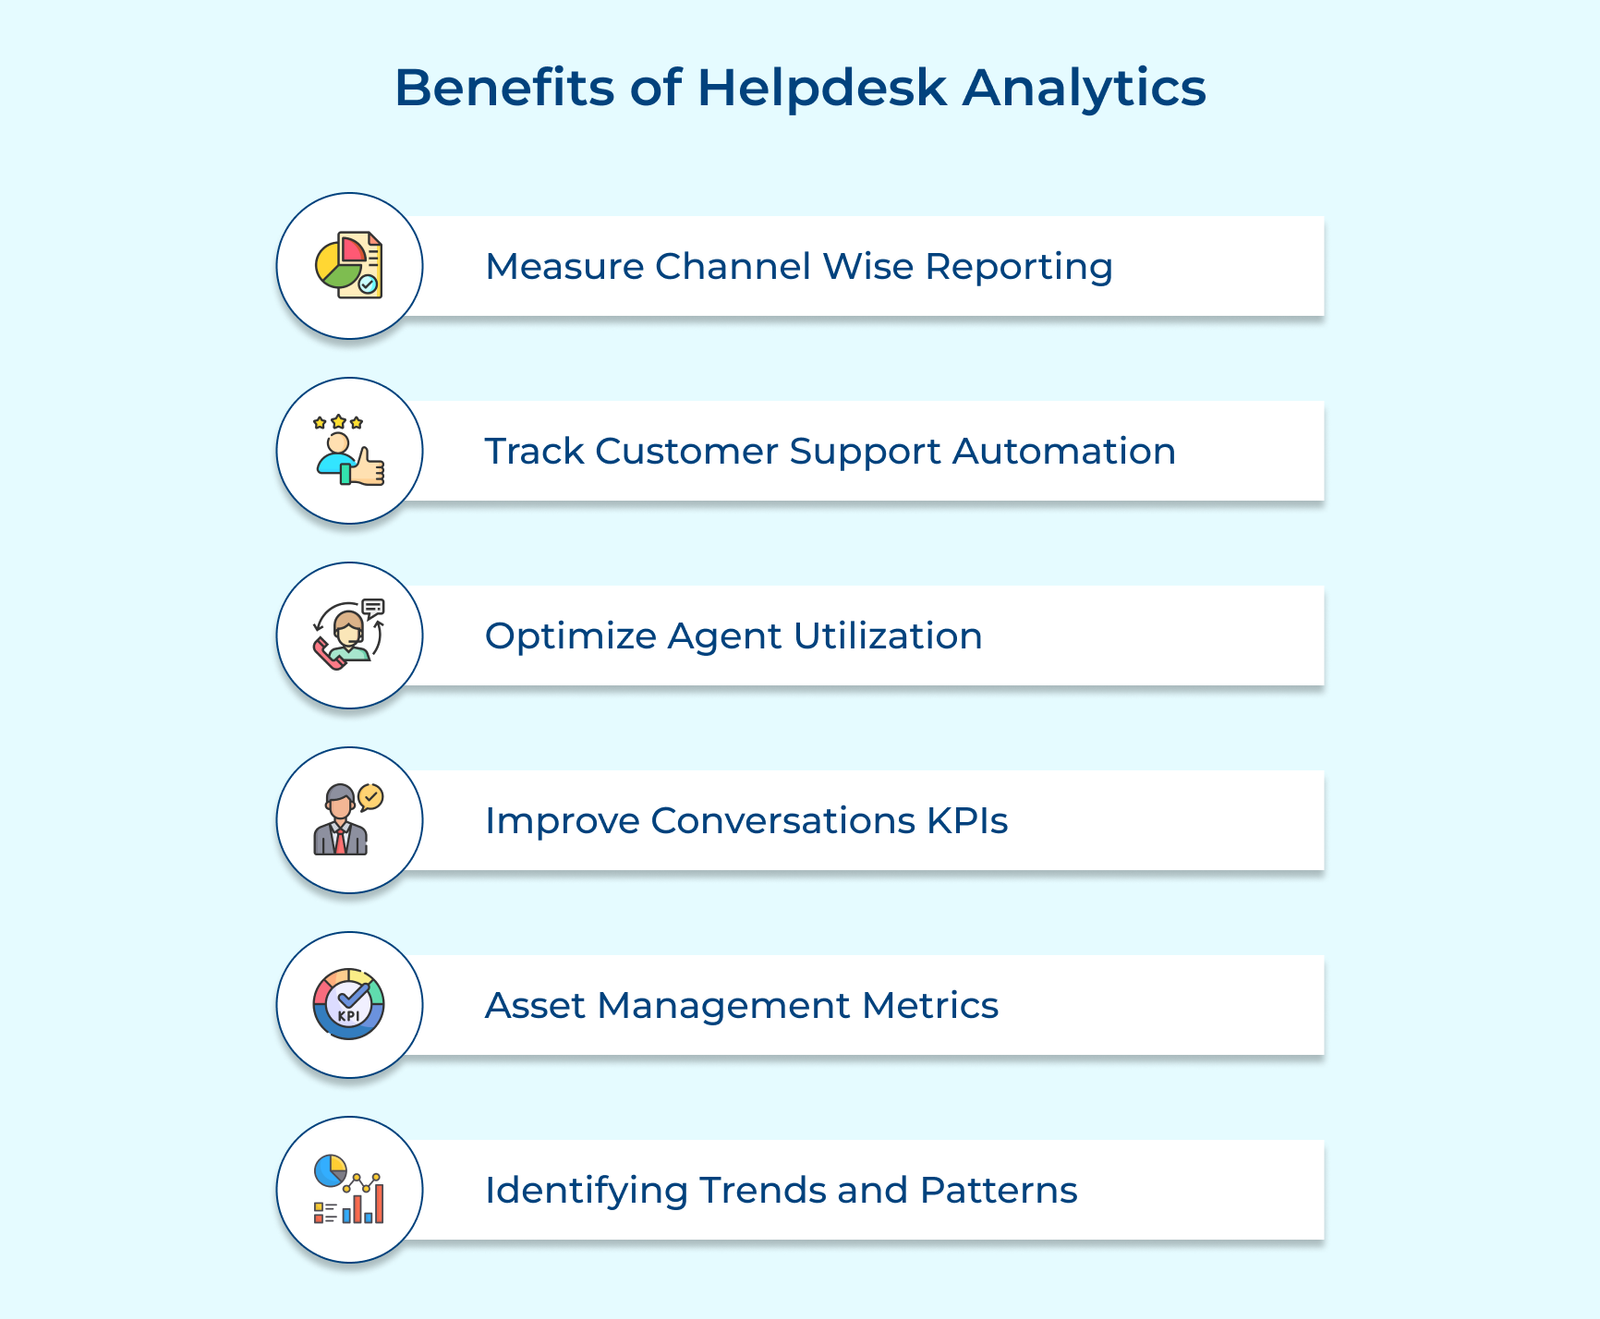
Benefits of Helpdesk Analytics

Businesses can streamline their operations, identify areas for improvement, and monitor help desk SLAs to enhance the customer experience. Let’s take a brief look at more of its benefits:

Benefits of Helpdesk Analytics

Measure Channel Wise Reporting

Help desk analytics can generate detailed reports on the support channels being used. It allows users to measure their customer service success across varied platforms such as email, messaging and social media. It allows businesses to identify which channels are most effective in providing timely and satisfactory customer support.

Track Customer Support Automation

An effective help desk automation system can reduce the need for customer support reps by offloading common tasks through automated processes. The automation improves efficiency by reducing the workload of customer support reps and enhances the customer experience.

Optimize Agent Utilization

Allows businesses to ensure that their resources, specifically their support agents are being used efficiently. Help desk analytics provides businesses with precise insights into how their agents are being utilized. It allows them to make data-driven decisions to allocate resources when they are most needed.

Improve Conversations KPIs

Get detailed data about conversations between agents and customers with metrics. It can include average talk time and average ticket resolution time to optimize customer interactions. Utilizing helpdesk analytics can help businesses gain valuable insights into their customer conversations and identify areas for improvement.

Asset Management Metrics

Track asset availability usage through service desk analytics systems to ensure optimal allocation of technical equipment across the organization. Monitoring asset usage can help organizations identify patterns or trends that may indicate a need for additional equipment or resources.

Identifying Trends and Patterns

Help desk dashboard analytics provide valuable insights into trends and patterns in support tickets. Analyzing the types of issues customers frequently face can help businesses identify recurring problems and take proactive steps to address them. It can result in reduced ticket volume, improved customer experience and increased customer loyalty.

How to Improve Your Customer Support with Help Desk Analytics

Analyzing data related to customer interactions and ticket resolutions gives businesses valuable insights into their support processes. Let us understand how exactly brands utilize online desk analytics to optimize their customer support.

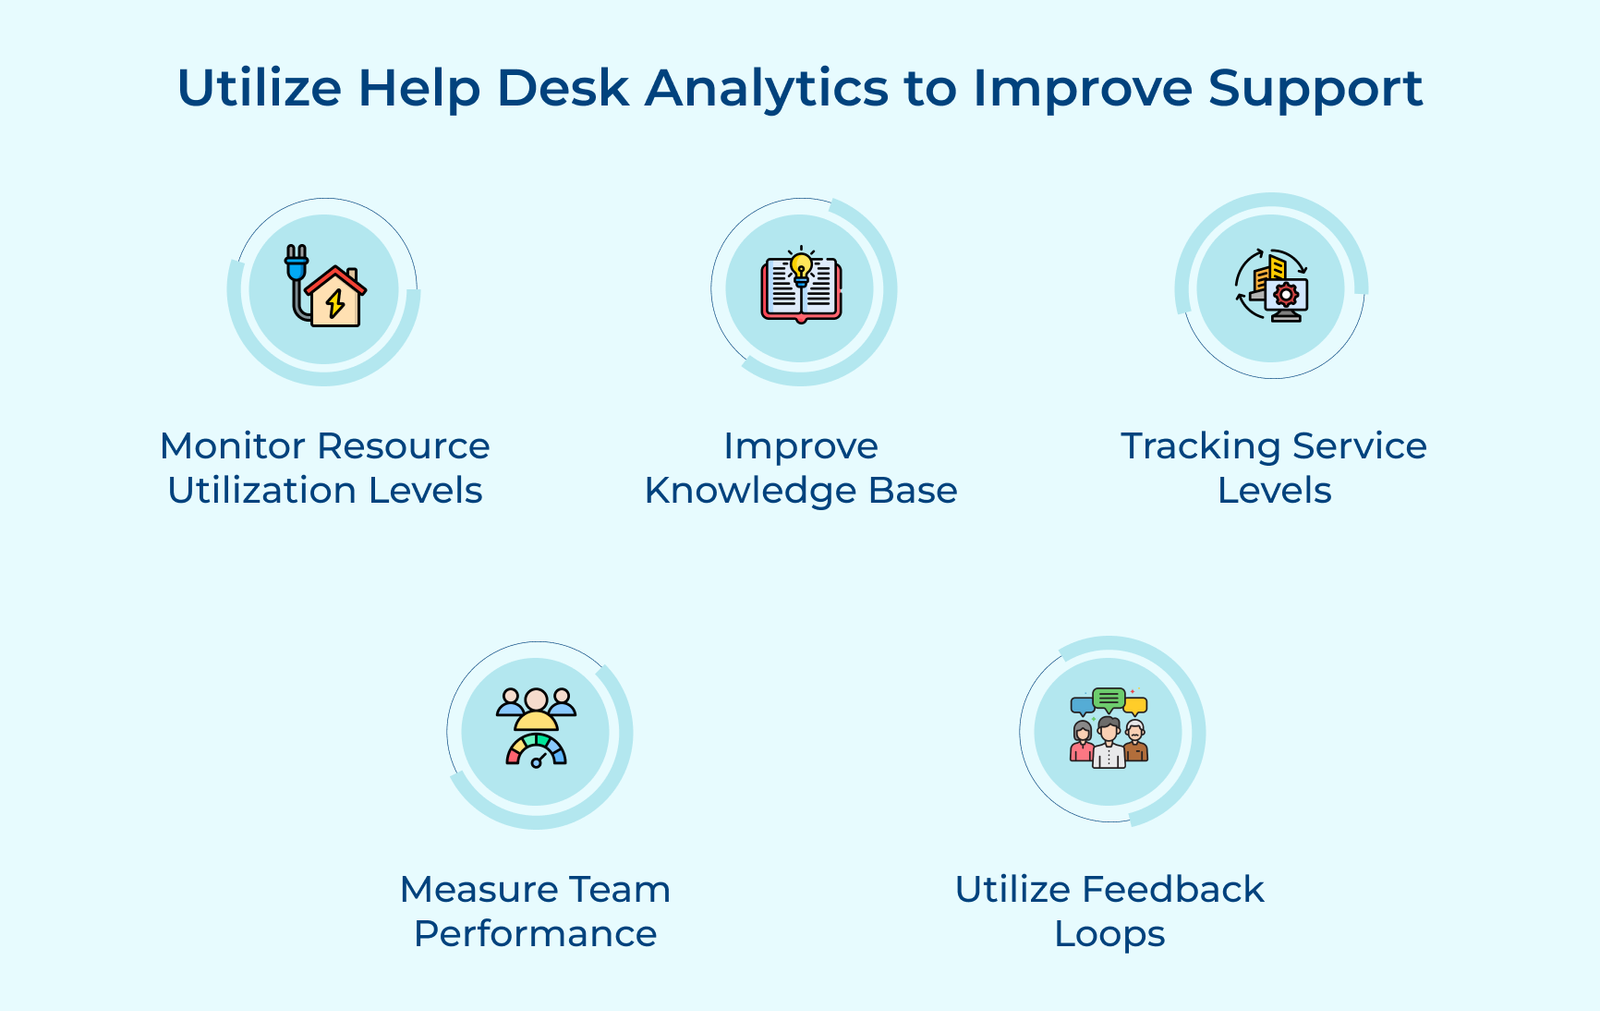
Utilize Help Desk Analytics to Improve Support

1. Monitor Resource Utilization Levels

Monitoring resource utilization levels through the service desk dashboard is crucial for optimizing customer support operations. Tracking agent workload and availability can help businesses ensure that resources are allocated efficiently, preventing overload or underutilization.

Analytics can identify bottlenecks and inefficiencies, such as recurring issues that consume excessive agent time or peak periods with high ticket volumes. The valuable insight allows for proactive resource allocation and scheduling.

Pro tips:

  • Establish clear metrics for agent workloads such as tickets handled per hour, average handling time and idle time.
  • Implement real-time monitoring systems to quickly identify and address resource constraints or imbalances.
  • Leverage forecasting models to anticipate demand fluctuations and plan resource allocation.

2. Improve Knowledge Base with Trending Topics

Utilizing help desk analytics can revolutionize customer support by improving the knowledge base with trending topics. Businesses can pinpoint areas where their knowledge base may be lacking by analyzing frequently asked questions and common issues.

The data-driven approach allows businesses to identify knowledge gaps and update their knowledge base. It ensures that it remains relevant and addresses the customers’ most pressing concerns.

Pro tips:

  • Regularly monitor and analyze ticket data: Continuously track the topics, keywords and issues that customers are raising. Use the information to prioritize knowledge base updates.
  • Involve subject matter experts: Collaborate with internal experts to ensure that new knowledge base content is accurate, comprehensive and aligns with the offerings.
  • Encourage feedback and continuous improvement: Solicit feedback from customers and support agents to identify areas for improvement. Continuously refine their knowledge base based on their insights.

3. Tracking Service Levels

Providing exceptional support is paramount. The service desk dashboard plays a crucial role in measuring and improving service levels. Businesses gain invaluable insights into their support operations by tracking KPIs like response times and resolution rates.

Measuring KPIs enables organizations to set realistic service level agreements (SLAs), ensuring transparency and managing customer expectations.

Pro tips:

  • Establishing clear KPI definitions and measurement methodologies to ensure consistent data collection.
  • Regularly analyzing KPI trends and identifying areas for improvement such as recurring issues or bottlenecks in the support process.

4. Measure Team Performance with Scorecards

Utilizing helpdesk dashboard analytics can revolutionize customer support by providing a comprehensive view of team performance through customized scorecards. Businesses can gain valuable insights into areas of strength and improvement by defining metrics for performance.

Customized scorecards and dashboards allow businesses to track these metrics in real time. It enables businesses to identify top performers and pinpoint areas where coaching is needed. The data-driven approach empowers businesses to make informed decisions, allocate resources and continuously enhance their team’s performance.

Pro tips:

  • Set clear and achievable performance goals for the help desk team. Defining metrics can help team members have a clear understanding of what is expected of them.
  • Regularly analyze performance data to identify trends and areas for improvement. Managers can make informed decisions and implement targeted training programs.
  • Utilize real-time helpdesk reporting to track performance and make data-driven decisions on the fly. Service desk dashboard managers can quickly respond to changing circumstances.

5. Utilize Feedback Loops

Leveraging feedback loops is crucial for enhancing the customer support experience. Businesses gain invaluable insights into their pain points improvement areas by collecting feedback. Implement changes based on the feedback such as streamlining processes, improving communication channels or providing additional training to support staff.
Close the feedback loop by informing customers about the changes made in response to their input and monitor the impact of the changes on customer satisfaction levels.

Pro tips:

  • Make it easy for customers to provide feedback through multiple channels such as post-interaction surveys, social media, or dedicated feedback forms.
  • Establish a systematic process for analyzing feedback data, identifying trends and prioritizing areas for improvement based on customer impact.
  • Regularly communicate with customers about the changes implemented based on their feedback.

Helpdesk Dashboard Examples and Use Cases

Helpdesk dashboards offer a wide range of functionalities that can streamline helpdesk operations and drive better outcomes for a business. Here are some of those examples and use cases to learn from:

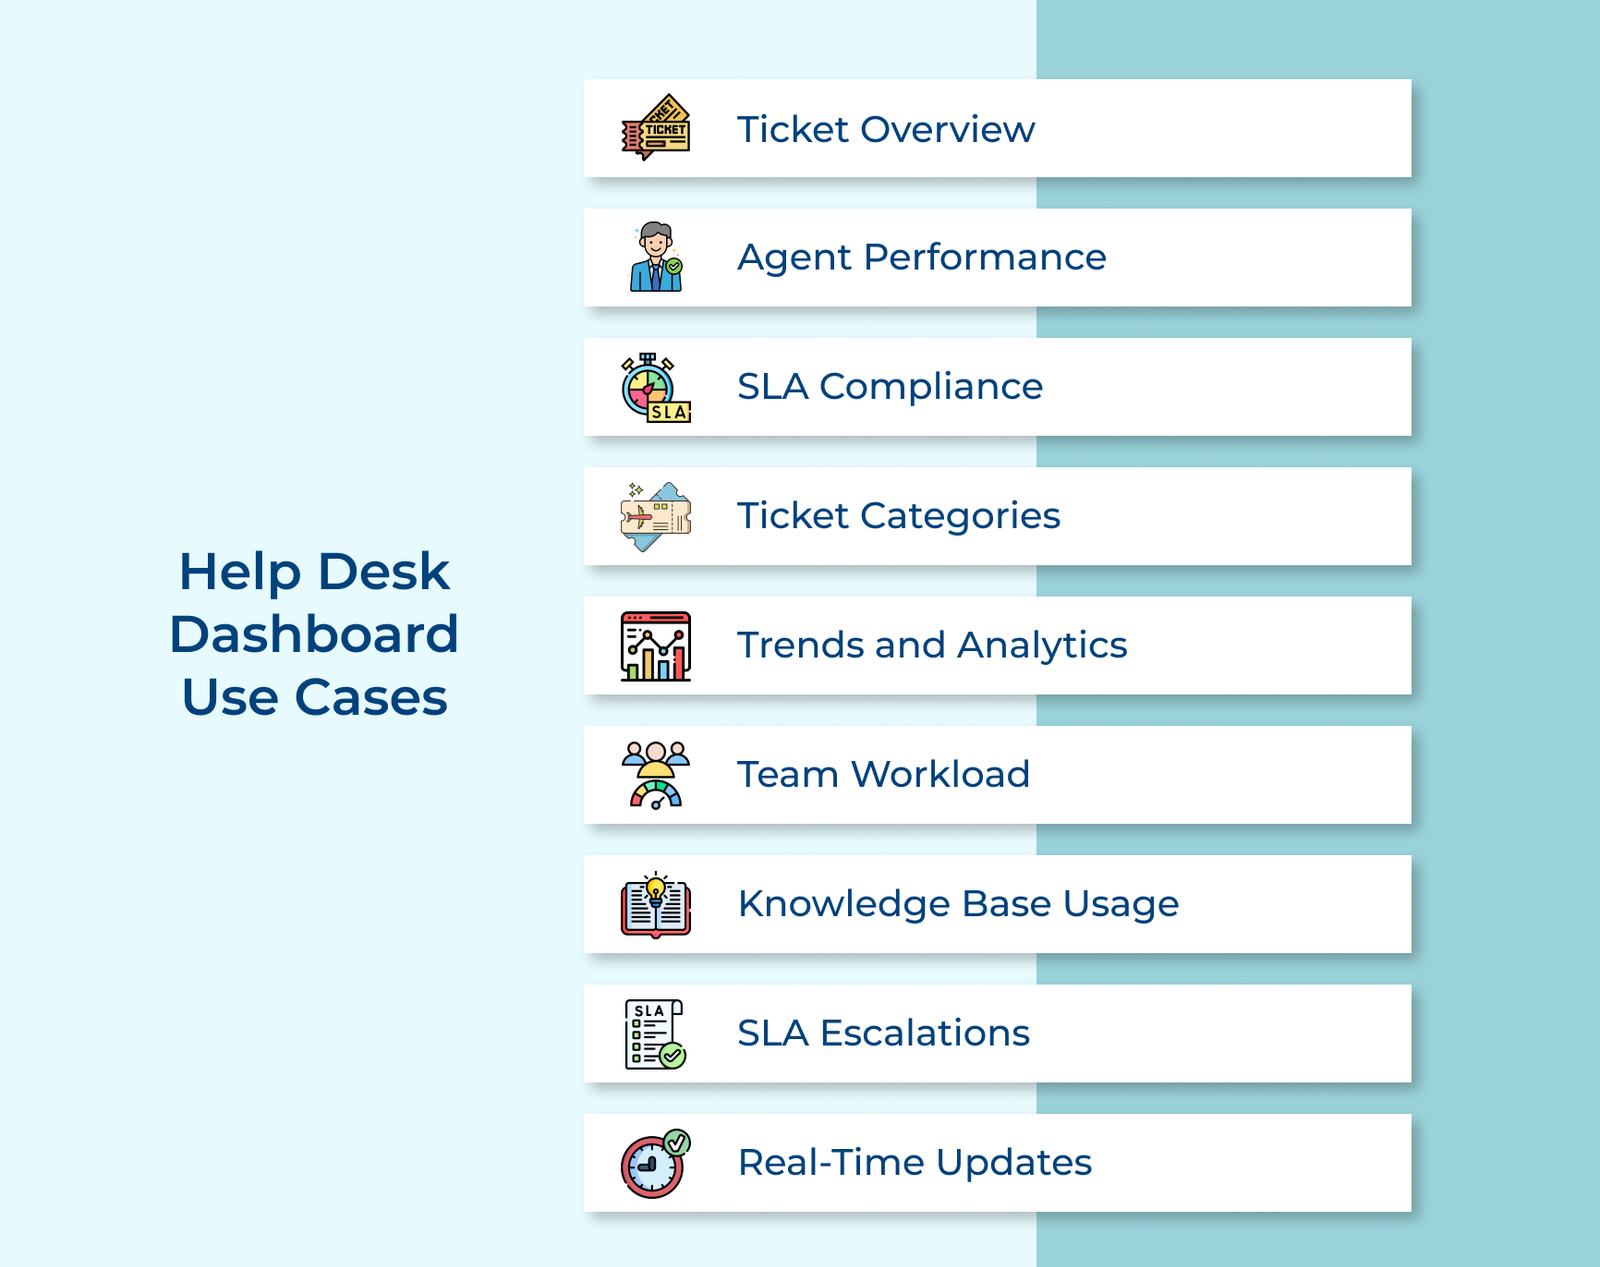
Help Desk Dashboard Use Cases
  • Ticket Overview
    The dashboard can display a summary of open and closed tickets along with their status. Brands get a quick snapshot of the workload and can prioritize their tasks in a better manner.
  • SLA Compliance
    Service level agreements (SLAs) define response and resolution times for tickets. The dashboard can show the percentage of tickets resolved within the agreed SLA timeframe. It highlights if there are any breaches or areas where SLAs are not being met.
  • Ticket Categories
    Helpdesk dashboards can provide insights into the types of issues customers are facing by displaying ticket categories or tags. Businesses can identify common trends and areas that may require additional support or training.
  • Trends and Analytics
    Dashboards may include visualizations and charts that show trends over time. Managers can efficiently track performance and make data-driven business decisions.
  • Team Workload
    A dashboard can display the workload distribution among agents, showing the number of tickets assigned to each team member. The approach keeps the workload balanced and prevents any agent from being overwhelmed.
  • Knowledge Base Usage
    If a help desk has a knowledge base, the dashboard can display metrics related to its usage such as the number of articles accessed or the most popular articles. Leaders can understand the gaps in knowledge and areas where they might need some additional resources.
  • SLA Escalations
    The service desk dashboard can highlight tickets that have breached the agreed-upon response or resolution times in cases where SLAs are not being met.
  • Real-Time Updates
    A helpdesk dashboard can provide real-time updates, refreshing data automatically to provide the most up-to-date information. It allows managers and agents to monitor performance in real time.

Common Metrics Used in Helpdesk Analytics

Here we will explore some of the most common metrics used in helpdesk analytics. Understanding the metrics and how they impact help desk performance can help brands optimize support strategies:

1. Ticket Volume

The metric tracks the total number of support tickets received within a specific time frame such as daily, weekly or monthly. Analyzing ticket volume can help identify peak periods, staffing requirements and areas that may require additional resources or training.

2. First Response Time (FRT)

FRT measures the average time it takes for a support agent to respond to a new ticket. Monitoring it is crucial as it directly impacts customer satisfaction. A prompt initial response can help set expectations and provide a positive customer experience, even if the issue takes longer to resolve.

3. Resolution Time

The metric measures the average time it takes to resolve a support ticket from the time it was created until it is closed. Tracking resolution times can help identify bottlenecks, inefficiencies and areas where additional improvements may be required.

4. First Contact Resolution (FCR)

FCR measures the percentage of tickets that are resolved during the initial interaction with the customer, without the need for follow-up or escalation. A high FCR rate indicates that support agents are effectively addressing customer issues on the first contact.

5. Customer Satisfaction (CSAT)

CSAT is a metric that gauges how satisfied customers are with the support they receive. It is typically measured through post-interaction surveys or feedback forms. Monitoring CSAT can provide valuable insights into the quality of support, identify areas for improvement and help maintain high levels of customer loyalty.

6. Self-Service Adoption

The rise of knowledge bases and self-service portals makes it important to track the adoption rate of these resources. It measures the percentage of customers who attempt to resolve their issues through self-service channels before contacting the helpdesk.

Build a Data-Driven Culture with Service Desk Analytics

Embracing a data-driven culture with service desk analytics is crucial for organizations to thrive. Organizations can gain invaluable insights into customer behaviour, operational efficiency and service quality by leveraging the wealth of data generated by service desk operations. Helpdesk analytics empower organizations to make informed decisions and proactively address issues.

A data-driven approach enhances continuous improvement, enabling organizations to identify areas for optimization and implement effective strategies. A data-driven culture backed by help desk analytics enhances satisfaction and positions organizations as industry leaders. Embracing the mindset is not merely a choice but a necessity for organizations seeking to stay competitive.

FAQs for Service Desk Analytics

Service desk analytics is the process of collecting, analyzing and visualizing data from service desks to gain insight into customer behavior. It typically involves leveraging a wide range of data sources for measuring customer satisfaction and other performance metrics.

Service desk analytics is important for providing valuable insights into the performance and efficiency of a service desk. Analyzing metrics such as response times, ticket resolution rates and customer satisfaction can help businesses identify areas for improvement. The data-driven approach helps to streamline operations, increase productivity and drive better outcomes.

Help desk performance can be measured by managing customer service issues. Setting up data tracking systems to measure how long it takes for customers to receive helpful solutions. Tracking the volume of daily inquiries, using analytics to get reports on average call wait times and customer satisfaction rates while monitoring customer feedback

Businesses should invest in a helpdesk analytics tool to improve customer service, increase efficiency and make data-driven decisions. Businesses can identify areas for improvement by analyzing customer interactions, response times and ticket resolution rates. Helpdesk analytics tools provide valuable insights that can lead to more satisfied customers.

Helpdesk analytics can help in identifying customer service issues by tracking key metrics such as ticket resolution time, customer satisfaction ratings and common customer complaints. Businesses can pinpoint areas for improvement, implement targeted solutions and enhance the customer experience by analyzing the data. Leveraging helpdesk analytics is essential for identifying and resolving customer service issues effectively.